

Support and resistance zones are foundational concepts in forex trading, offering critical insights into price behavior and helping traders make informed decisions. These zones represent levels where price movements often pause, reverse, or consolidate, making them valuable tools for identifying entry and exit points, setting stop-loss levels, and understanding market sentiment.
This blog explores how to effectively use support and resistance zones in forex trading, covering their identification, significance, and practical application in trading strategies.
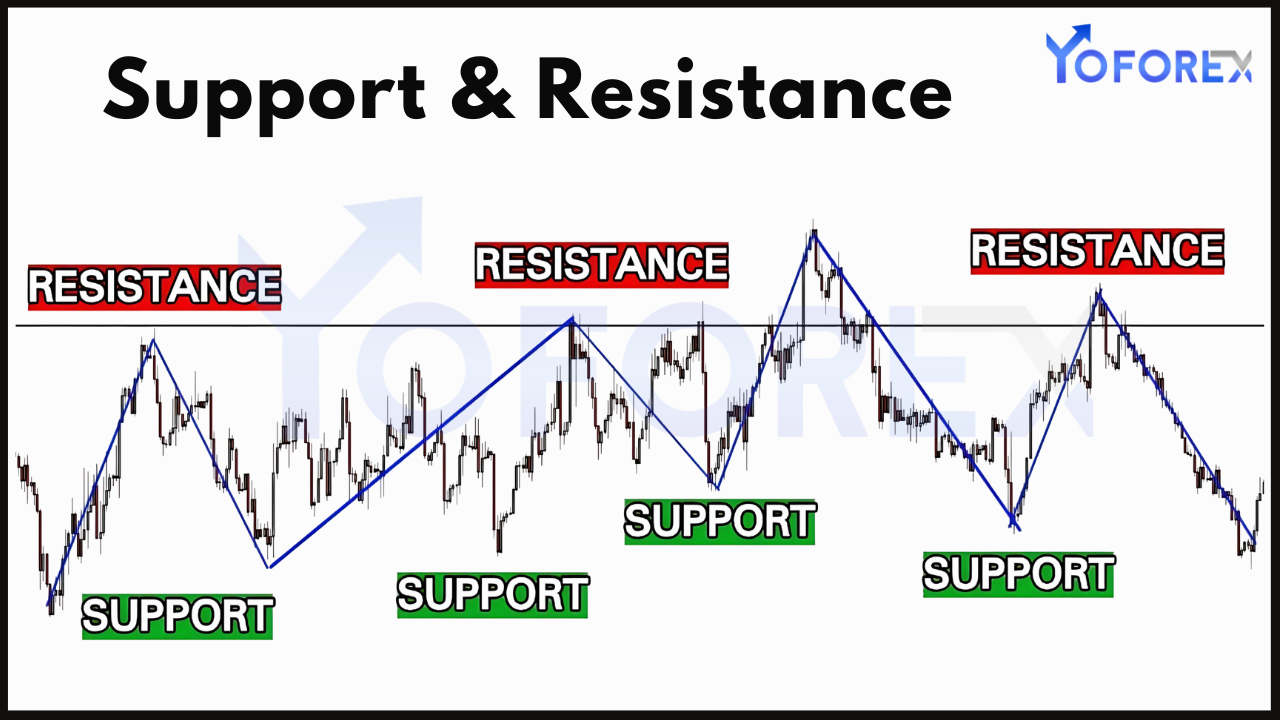
What Are Support and Resistance Zones?
Support Zone:
A support zone is a price level where demand is strong enough to prevent the price from falling further. Traders expect the price to bounce back from this level as buyers outnumber sellers.
Resistance Zone:
A resistance zone is a price level where selling pressure is strong enough to prevent the price from rising further. Traders anticipate the price to reverse or consolidate as sellers outnumber buyers.
Why Support and Resistance Zones Matter
- Price Reaction Areas:
- These zones indicate levels where market participants have historically shown interest, leading to potential reversals or breakouts.
- Entry and Exit Points:
- Traders use these levels to time their trades effectively, entering near support and exiting near resistance.
- Risk Management:
- Support and resistance zones help set stop-loss and take-profit levels to minimize risk and maximize rewards.
- Market Sentiment:
- These zones reflect the collective sentiment of buyers and sellers, providing clues about potential market movements.
How to Identify Support and Resistance Zones
1. Horizontal Levels
- Price Clusters:
- Look for areas where the price has repeatedly reversed or consolidated in the past.
- Round Numbers:
- Psychological levels like 1.2000 or 1.5000 often act as support or resistance.
2. Trendlines
- Uptrend:
- Connect higher lows to identify ascending support.
- Downtrend:
- Connect lower highs to identify descending resistance.
3. Moving Averages
- Moving averages, such as the 50-day or 200-day MA, often act as dynamic support or resistance levels.
4. Fibonacci Retracement Levels
- Use Fibonacci tools to identify potential support and resistance zones based on key retracement levels like 38.2%, 50%, and 61.8%.
5. Pivot Points
- Calculate daily, weekly, or monthly pivot points to identify potential turning points in the market.
Using Support and Resistance Zones in Forex Trading
1. Range Trading
Range trading involves identifying a range-bound market and trading between support and resistance levels.
- Strategy:
- Buy near support and sell near resistance.
- Use oscillators like RSI to confirm overbought or oversold conditions.
- Example:
- In a sideways market, if EUR/USD approaches a support zone at 1.1000, consider a long position with a stop-loss below the support level.
2. Breakout Trading
Breakout trading involves taking positions when the price breaks above resistance or below support.
- Strategy:
- Enter a trade in the direction of the breakout.
- Confirm the breakout with increased volume or candlestick patterns.
- Example:
- If GBP/USD breaks above resistance at 1.3000, consider a buy position with a target at the next resistance level.
3. Trend Following
Support and resistance zones help traders identify pullbacks within a trend.
- Strategy:
- Enter long positions near support in an uptrend or short positions near resistance in a downtrend.
- Use moving averages or trendlines to confirm the trend.
- Example:
- In an uptrend, if USD/JPY retraces to a support zone at 145.00, consider entering a long position.
4. Reversal Trading
Reversal trading involves identifying potential turning points at strong support or resistance zones.
- Strategy:
- Look for reversal candlestick patterns like hammers or shooting stars.
- Use divergence in indicators like MACD or RSI for confirmation.
- Example:
- If AUD/USD forms a bullish engulfing pattern near a support zone, consider entering a long position.
Combining Support and Resistance with Other Tools
1. Candlestick Patterns
- Example:
- A doji near a resistance zone signals indecision and potential reversal.
2. Indicators
- RSI:
- Use RSI to confirm overbought conditions near resistance or oversold conditions near support.
- MACD:
- Look for MACD crossovers near key zones to confirm potential entries or exits.
3. Volume Analysis
- High volume near support or resistance zones often confirms the strength of the level.
Risk Management
- Set Stop-Loss Orders:
- Place stop-loss orders below support for long positions or above resistance for short positions.
- Adjust Position Sizes:
- Use smaller position sizes near key zones to manage risk during high volatility.
- Avoid Overtrading:
- Focus on high-probability setups and avoid chasing every price movement.
- Be Flexible:
- If a zone is breached, reevaluate the setup and adapt to changing market conditions.
Common Mistakes to Avoid
- Forcing Trades:
- Avoid entering trades based solely on support or resistance without confirmation.
- Ignoring Market Context:
- Consider the overall trend and fundamental factors influencing price action.
- Setting Unrealistic Targets:
- Base profit targets on realistic expectations and historical price movements.
- Neglecting False Breakouts:
- Watch for fakeouts, where the price briefly breaches a level before reversing.
Practical Example
Scenario:
- Currency Pair: USD/CHF
- Timeframe: 4-hour chart
- Identification:
- The resistance zone is at 0.9300 and the support zone is at 0.9100.
- Action:
- Enter a long position near 0.9100 after confirming with a bullish engulfing candlestick.
- Set a stop-loss at 0.9050 and a take-profit target at 0.9300.
- Outcome:
- The price rebounds from the support zone and reaches the target, yielding a profitable trade.
Conclusion
Support and resistance zones are essential tools for forex traders, offering valuable insights into price behavior and helping identify trading opportunities. By understanding how to identify and use these zones effectively, traders can improve their decision-making and achieve better results. Combining support and resistance analysis with other technical tools, disciplined risk management, and a clear trading plan is the key to success in forex trading.