

In the world of Forex trading, technical analysis plays a key role in helping traders make informed decisions. One of the most popular tools in technical analysis is the Stochastic Oscillator, a momentum indicator that can help traders identify overbought and oversold conditions in the market. Developed by George Lane in the late 1950s, the Stochastic Oscillator compares a security’s closing price to its price range over a specified time. This tool is widely used to generate buy and sell signals, detect trends, and confirm market momentum. In this blog, we will dive into the basics of using the Stochastic Oscillator in Forex analysis, explaining how it works, how to interpret its signals, and how to apply it in your trading strategies.
What is the Stochastic Oscillator?
The Stochastic Oscillator is a momentum-based indicator that measures the location of the current closing price relative to its price range over a given period. The indicator consists of two lines:
- %K Line: The main line of the Stochastic Oscillator, which shows the current position of the closing price relative to the high-low range of the past N periods.
- %D Line: The moving average of the %K line, typically a 3-period simple moving average (SMA). The %D line acts as a signal line for the %K line and is used to generate trading signals.
The formula for the %K line is:
%K=((C−Ln)(Hn−Ln))×100%K = left( frac{(C – L_n)}{(H_n – L_n)} right) times 100
Where:
- C is the current closing price.
- L_n is the lowest low over the past N periods.
- H_n is the highest high over the past N periods.
The %D line is simply a moving average of the %K line, smoothing out its fluctuations.
How Does the Stochastic Oscillator Work?
The Stochastic Oscillator operates on the premise that during an uptrend, closing prices tend to be near the high of the price range, while in a downtrend, closing prices tend to be near the low of the price range. This characteristic makes the Stochastic Oscillator a great tool for identifying overbought and oversold conditions, as well as potential trend reversals.
The oscillator values range from 0 to 100, and the key levels to watch are 20 and 80:
- Overbought Condition: When the Stochastic Oscillator rises above 80, it indicates that the asset is overbought and may be due for a price correction or reversal.
- Oversold Condition: When the Stochastic Oscillator falls below 20, it suggests that the asset is oversold and could be primed for a potential upward reversal.
However, it’s important to remember that the Stochastic Oscillator is not always accurate on its own and should be used in conjunction with other indicators and analysis to confirm signals.
Interpreting the Stochastic Oscillator
- Overbought and Oversold Conditions
As mentioned, the Stochastic Oscillator helps traders identify overbought and oversold conditions. When the %K line rises above 80, it suggests that the market may be overbought, and a reversal or pullback could occur. Conversely, when the %K line drops below 20, it indicates oversold conditions, signaling the potential for a price reversal to the upside.
However, these signals are not always reliable on their own, as the market can remain in overbought or oversold conditions for extended periods during strong trends. Therefore, traders should watch for confirmation from other indicators (such as trendlines or volume) or candlestick patterns to validate the signals.
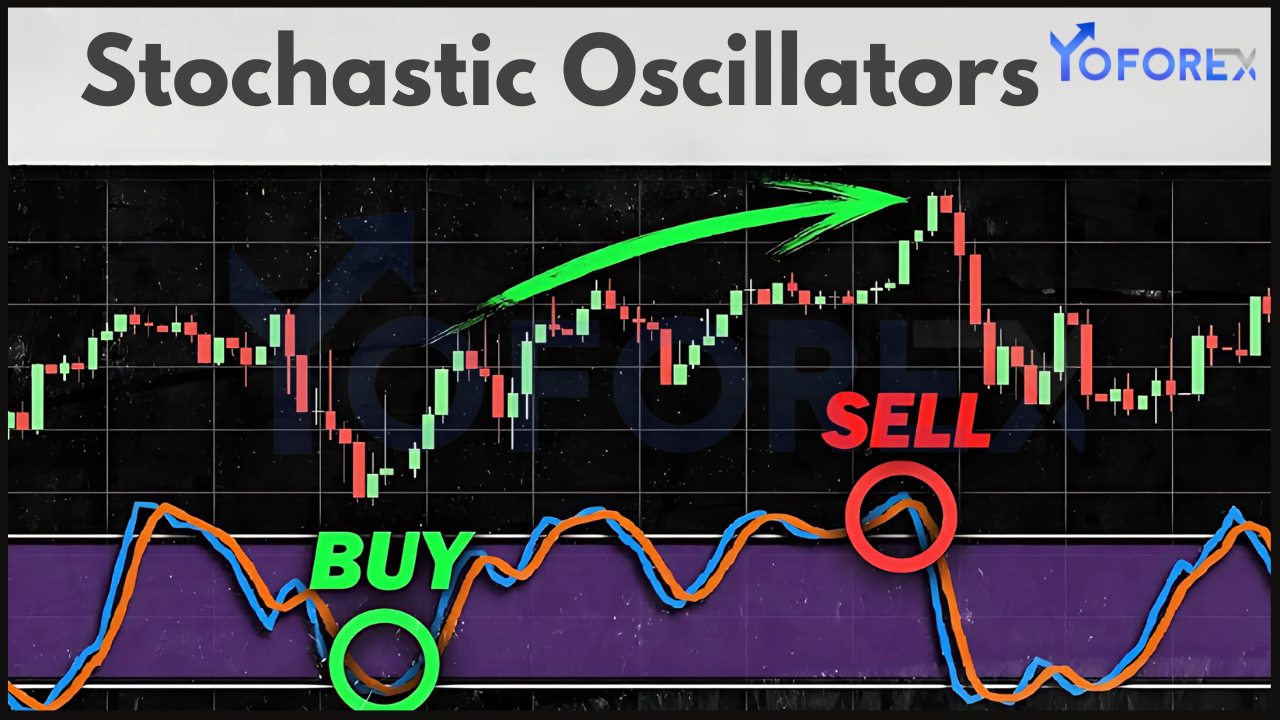
- Crossovers Between %K and %D Lines
The most commonly used signal generated by the Stochastic Oscillator is the crossover of the %K line and the %D line. When the %K line crosses above the %D line, it is considered a bullish signal, indicating that the price may be about to rise. Conversely, when the %K line crosses below the %D line, it is considered a bearish signal, suggesting that the price could move lower.
Crossovers are more reliable when the Stochastic Oscillator is in overbought or oversold territory. For example:
- A bullish crossover (when %K crosses above %D) in oversold conditions (below 20) is often seen as a strong buy signal.
- A bearish crossover (when %K crosses below %D) in overbought conditions (above 80) is often viewed as a strong sell signal.
- Divergence Between Price and the Stochastic Oscillator
Divergence occurs when the price action and the Stochastic Oscillator show opposing trends, which can signal a potential reversal or weakening of the current trend. There are two types of divergence to watch for:
- Bullish Divergence: This occurs when the price is making lower lows, but the Stochastic Oscillator is making higher lows. This suggests that despite the price continuing to fall, the momentum is weakening, and a reversal to the upside might be imminent.
- Bearish Divergence: This happens when the price is making higher highs, but the Stochastic Oscillator is making lower highs. This indicates that the price is pushing higher, but the momentum is weakening, potentially signaling an upcoming reversal to the downside.
Divergence can be a powerful signal, but it’s important to wait for confirmation from other indicators before acting on it.
Best Practices for Using the Stochastic Oscillator in Forex Analysis
- Adjusting the Time Period
The default setting for the Stochastic Oscillator is typically 14 periods, but this can be adjusted based on the trader’s preferences and the market being analyzed. Shorter time periods will make the indicator more sensitive, providing more signals but also increasing the risk of false signals. Longer time periods will make the indicator smoother, reducing the number of signals but increasing the reliability of those that are generated.
- Combine with Trend Analysis
While the Stochastic Oscillator is an excellent tool for identifying overbought and oversold conditions, it should be used in conjunction with trend analysis. In strong trends, the indicator can remain in overbought or oversold territory for extended periods, and following the trend may be more profitable than trying to time reversals. Use trend-following tools like moving averages, trendlines, or the Average Directional Index (ADX) to confirm the trend before using the Stochastic Oscillator to time entries and exits.
- Use in Conjunction with Other Indicators
The Stochastic Oscillator works best when combined with other technical indicators that can confirm or filter its signals. For example, pairing the Stochastic Oscillator with a Relative Strength Index (RSI) or Bollinger Bands can provide additional insights into market conditions and improve the accuracy of your trades.
- Avoid False Signals in Range-bound Markets
In sideways or range-bound markets, the Stochastic Oscillator can generate a lot of false signals, as prices move between support and resistance levels without trending strongly in either direction. In such markets, it’s better to wait for a strong trend to develop before relying on the Stochastic Oscillator for entry signals.
Conclusion
The Stochastic Oscillator is a powerful tool in Forex analysis that helps traders identify overbought and oversold conditions, generate buy and sell signals, and detect potential trend reversals. By understanding how to interpret the indicator, use crossovers, recognize divergences, and combine it with other technical analysis tools, traders can significantly improve their trading strategies. However, like all technical indicators, the Stochastic Oscillator should be used in conjunction with other analysis techniques to ensure the best possible outcomes in your Forex trading. Remember that no indicator is foolproof, and risk management should always be a top priority.