

The Relative Strength Index (RSI) is one of the most popular and effective tools in technical analysis, particularly in forex trading. As an oscillator, RSI helps traders determine overbought and oversold market conditions, providing actionable signals for potential trend reversals or continuations. By incorporating RSI into a well-structured trading strategy, traders can enhance their decision-making and improve their profitability.
This blog will explore the basics of RSI, how it works, and step-by-step instructions to develop a forex trading strategy using RSI.
Understanding RSI
RSI is a momentum oscillator developed by J. Welles Wilder. It measures the speed and magnitude of price movements to evaluate whether a currency pair is overbought or oversold.
Key Features of RSI:
- Scale: RSI ranges from 0 to 100.
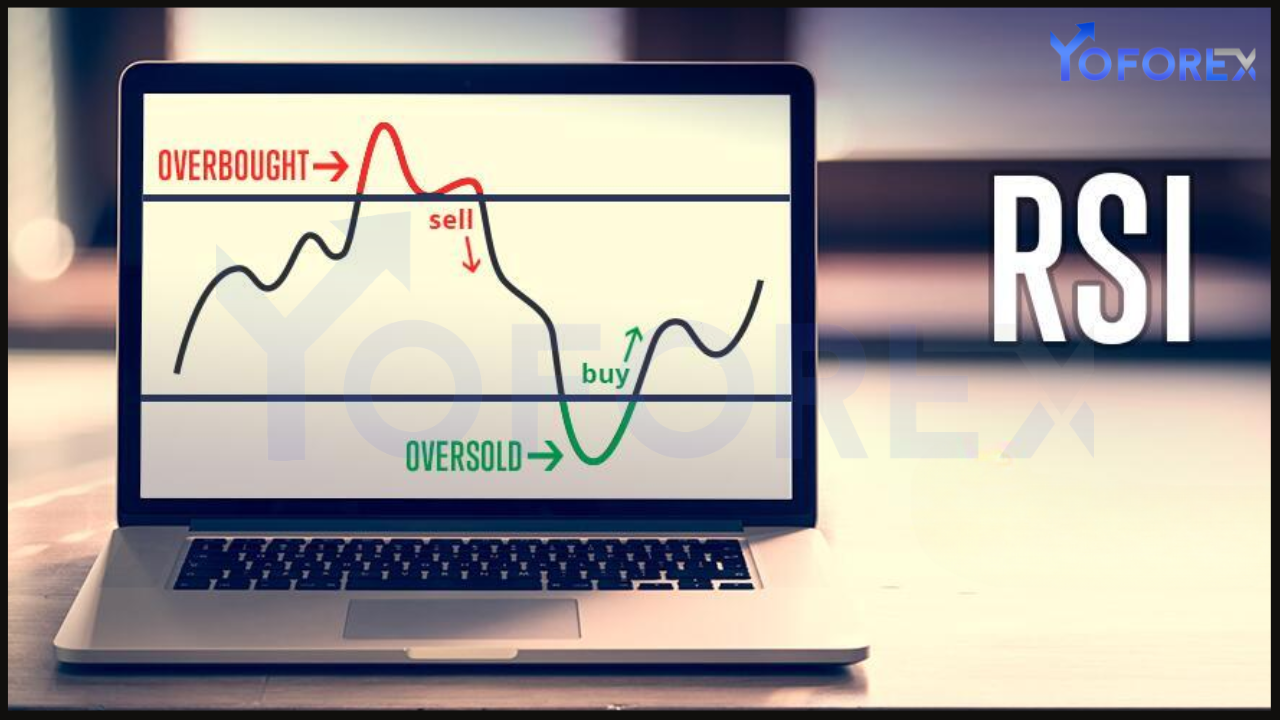
- Overbought Level: A reading above 70 indicates overbought conditions, suggesting that the price may soon reverse downward.
- Oversold Level: A reading below 30 indicates oversold conditions, suggesting that the price may reverse upward.
- Default Period: The standard RSI calculation uses 14 periods, though this can be adjusted to suit different trading styles.
RSI Formula:
RSI = 100 – [100 / (1 + RS)]
Where RS = Average Gain / Average Loss over a specified period.
Why Use RSI in Forex Trading?
RSI is a versatile tool that provides several benefits for forex traders:
- Identifying Overbought and Oversold Conditions:
- RSI highlights potential reversal zones, enabling traders to time their entries and exits.
- Spotting Divergences:
- RSI divergence occurs when the price moves in the opposite direction of the RSI, signaling potential trend reversals.
- Confirming Trends:
- RSI can validate the strength of a trend, helping traders decide whether to hold their positions or exit.
- Combining with Other Indicators:
- RSI works well alongside other tools like moving averages or Bollinger Bands for more robust strategies.
Developing an RSI-Based Forex Trading Strategy
Here’s a step-by-step guide to building an effective forex trading strategy using RSI.
Step 1: Define Your Trading Goals and Style
Before diving into RSI, determine your trading objectives and style:
- Scalping: Use shorter RSI periods (e.g., 7) for quicker signals.
- Day Trading: Stick to the default 14-period RSI on intraday charts.
- Swing Trading: Use longer periods (e.g., 21) on daily or weekly charts to capture broader trends.
Step 2: Choose the Right RSI Settings
Adjust the RSI period based on your trading style:
- Short-Term Trading: Lower periods (e.g., 7 or 9) for faster but potentially less reliable signals.
- Long-Term Trading: Higher periods (e.g., 21) for smoother, more reliable signals.
Step 3: Identify Overbought and Oversold Zones
Use the standard 70 and 30 levels to define overbought and oversold conditions:
- Overbought Zone: RSI > 70 signals that the currency pair may be due for a bearish reversal.
- Oversold Zone: RSI < 30 suggests that the pair may be due for a bullish reversal.
Step 4: Look for RSI Divergences
RSI divergence is a powerful signal of potential trend reversals:
- Bullish Divergence:
- Price forms lower lows, but RSI forms higher lows. This indicates weakening bearish momentum and a possible upward reversal.
- Bearish Divergence:
- Price forms higher highs, but RSI forms lower highs. This signals weakening bullish momentum and a potential downward reversal.
Step 5: Combine RSI with Other Indicators
For higher accuracy, pair RSI with complementary tools:
- Moving Averages:
- Use moving averages to confirm the trend direction before acting on RSI signals.
- Bollinger Bands:
- Combine RSI with Bollinger Bands to identify overbought or oversold conditions near the bands.
- Support and Resistance Levels:
- Confirm RSI signals at key support or resistance zones to strengthen your strategy.
Step 6: Develop Entry and Exit Rules
Clearly define when to enter and exit trades based on RSI:
- Entry:
- Go long when RSI crosses above 30 from an oversold condition.
- Go short when RSI crosses below 70 from an overbought condition.
- Exit:
- Close the trade when RSI moves back into the neutral zone (30-70) or reaches an opposing extreme.
Step 7: Use Risk Management Techniques
Always incorporate risk management to protect your capital:
- Stop-Loss Orders:
- Place stop-loss orders below the recent swing low for long trades or above the recent swing high for short trades.
- Position Sizing:
- Adjust your position size based on your risk tolerance and account balance.
- Risk-to-Reward Ratio:
- Aim for a favorable risk-to-reward ratio (e.g., 1:2 or 1:3).
Example RSI Trading Strategy
Strategy: RSI Divergence with Support/Resistance
- Setup:
- Use the default 14-period RSI.
- Identify key support and resistance levels on a 1-hour chart.
- Entry Rules:
- Look for bullish divergence near a support level:
- Price forms lower lows, but RSI forms higher lows.
- Enter a buy trade when RSI crosses above 30.
- Look for bearish divergence near a resistance level:
- Price forms higher highs, but RSI forms lower highs.
- Enter a sell trade when RSI crosses below 70.
- Look for bullish divergence near a support level:
- Exit Rules:
- Close the trade when RSI reaches the opposite extreme (e.g., close a long trade when RSI > 70).
- Alternatively, use a fixed take-profit target and a trailing stop-loss.
- Risk Management:
- Place a stop-loss below the support level for long trades or above the resistance level for short trades.
Common Mistakes to Avoid
- Overtrading:
- Avoid taking every RSI signal without additional confirmation.
- Ignoring Market Conditions:
- RSI is less effective in strongly trending markets. Use it primarily in ranging or mildly trending conditions.
- Overreliance on RSI:
- Combine RSI with other tools for a more comprehensive strategy.
- Poor Risk Management:
- Always use stop-loss orders and proper position sizing to minimize losses.
Tips for Success with RSI
- Backtest Your Strategy:
- Test your RSI strategy on historical data to evaluate its performance.
- Practice on a Demo Account:
- Use a demo account to refine your strategy before trading live.
- Stay Updated on Market Trends:
- Keep an eye on economic news and events that could impact forex markets.
- Adjust to Market Conditions:
- Adapt your RSI settings and strategy based on the prevailing market environment.
Conclusion
The RSI is a powerful tool for developing forex trading strategies, offering valuable insights into market momentum and potential reversal points. By understanding how RSI works and integrating it with other technical indicators, traders can create effective strategies tailored to their trading styles.
Remember, no strategy guarantees success. Consistent practice, disciplined execution, and robust risk management are essential for achieving long-term profitability in forex trading.