

Harmonic price patterns are a sophisticated and powerful tool in forex trading that allows traders to predict market reversals and continuations with remarkable precision. These patterns are rooted in the concept of geometric price patterns and the Fibonacci sequence, offering a systematic way to identify potential trading opportunities. This blog delves into the world of harmonic price patterns, their significance, and how they can enhance your forex trading strategies.
What Are Harmonic Price Patterns?
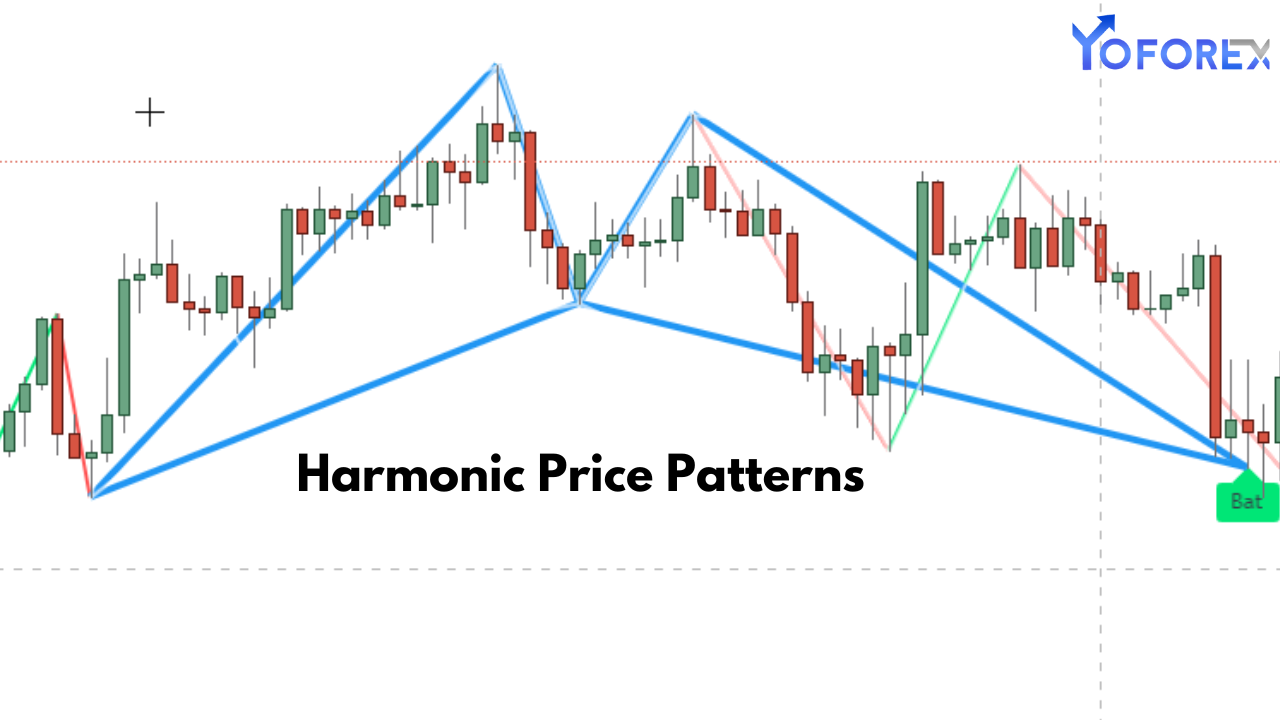
Harmonic price patterns are geometric patterns that use Fibonacci ratios to determine precise turning points in the market. By combining pattern recognition and Fibonacci retracement and extension levels, traders can predict potential price movements and execute high-probability trades.
Key Features of Harmonic Patterns:
- They rely on Fibonacci ratios (e.g., 0.618, 0.786, 1.27, 1.618) to identify critical price levels.
- They aim to capture price reversals by identifying overbought and oversold market conditions.
- They require strict adherence to pattern rules for accurate execution.
Why Are Harmonic Price Patterns Important in Forex Trading?
- High Accuracy:
- When correctly identified, harmonic patterns provide precise entry and exit points, enhancing trading accuracy.
- Systematic Approach:
- Harmonic patterns offer a rule-based framework, reducing emotional decision-making.
- Versatility:
- These patterns are applicable across various timeframes and forex pairs, making them a versatile tool.
- Risk Management:
- By identifying potential reversals early, traders can manage risk more effectively and set tight stop-loss levels.
Types of Harmonic Price Patterns
There are several harmonic patterns, each with unique characteristics and rules. Below are the most common types:
1. The Gartley Pattern
Description: The Gartley pattern is one of the most popular harmonic patterns, named after H.M. Gartley, who introduced it in 1935. It signals a potential reversal in the market.
Structure:
- Point X to A: An impulsive move.
- Point A to B: A retracement of 61.8% of XA.
- Point B to C: A retracement of 38.2% to 88.6% of AB.
- Point C to D: An extension of 127.2% to 161.8% of AB and a retracement of 78.6% of XA.
Trading Strategy:
- Enter at Point D with a stop-loss below/above the X point.
- Target levels can be set at the retracement levels of the CD leg.
2. The Butterfly Pattern
Description: The Butterfly pattern signals a reversal at the end of an extended move, often resulting in a significant trend change.
Structure:
- Point X to A: An impulsive move.
- Point A to B: A retracement of 78.6% of XA.
- Point B to C: A retracement of 38.2% to 88.6% of AB.
- Point C to D: An extension of 127.2% to 161.8% of XA.
Trading Strategy:
- Enter at Point D with a stop-loss beyond the structure.
- Target levels can be set at the retracement levels of the CD leg.
3. The Bat Pattern
Description: The Bat pattern is a continuation pattern that helps traders capture a trend correction before it resumes.
Structure:
- Point X to A: An impulsive move.
- Point A to B: A retracement of 38.2% to 50% of XA.
- Point B to C: A retracement of 38.2% to 88.6% of AB.
- Point C to D: A retracement of 88.6% of XA.
Trading Strategy:
- Enter at Point D with a stop-loss beyond the X point.
- Targets can be set at the retracement levels of the CD leg.
4. The Crab Pattern
Description: The Crab pattern is an extreme harmonic pattern that signals reversals at critical Fibonacci extension levels.
Structure:
- Point X to A: An impulsive move.
- Point A to B: A retracement of 38.2% to 61.8% of XA.
- Point B to C: A retracement of 38.2% to 88.6% of AB.
- Point C to D: An extension of 161.8% to 224% of XA.
Trading Strategy:
- Enter at Point D with a stop-loss beyond the structure.
- Targets can be set at the retracement levels of the CD leg.
5. The Shark Pattern
Description: The Shark pattern identifies sharp market reversals at Fibonacci extension levels, typically forming during volatile conditions.
Structure:
- Point X to A: An impulsive move.
- Point A to B: A retracement of 38.2% to 61.8% of XA.
- Point B to C: An extension of 113% to 161.8% of XA.
- Point C to D: A retracement of 88.6% of XA.
Trading Strategy:
- Enter at Point D with a stop-loss beyond the structure.
- Targets can be set at the retracement levels of the CD leg.
How to Trade Using Harmonic Patterns
- Identify the Pattern:
- Use harmonic pattern recognition tools or manually draw patterns on your charts using Fibonacci levels.
- Confirm the Pattern:
- Verify that each leg of the pattern aligns with the required Fibonacci ratios.
- Enter the Trade:
- Place a buy or sell order at Point D, which represents the potential reversal zone.
- Set Stop-Loss:
- Protect your trade by setting a stop-loss beyond the X point or the structure.
- Set Targets:
- Use Fibonacci retracement levels to determine potential profit targets.
Tips for Successful Harmonic Pattern Trading
- Practice Pattern Recognition:
- Familiarize yourself with the shapes and Fibonacci ratios of harmonic patterns through backtesting.
- Combine with Other Indicators:
- Use complementary tools like RSI, MACD, or moving averages to confirm trade setups.
- Be Patient:
- Wait for the pattern to complete before entering a trade.
- Manage Risk:
- Always use stop-loss orders and limit your risk per trade to a manageable percentage of your capital.
- Stay Updated on Market Conditions:
- Market volatility and external factors can influence the reliability of harmonic patterns.
Common Mistakes to Avoid
- Ignoring Fibonacci Levels:
- Ensure that each leg of the pattern matches the required ratios. Inaccurate measurements can lead to poor trades.
- Overtrading:
- Not every pattern is a high-probability setup. Focus on quality over quantity.
- Failing to Confirm with Other Tools:
- Relying solely on harmonic patterns without additional confirmation can increase the risk of false signals.
- Poor Risk Management:
- Always use stop-loss and position sizing to protect your account.
Conclusion
Harmonic price patterns offer a precise and systematic approach to forex trading, allowing traders to identify high-probability reversal and continuation setups. By mastering these patterns and adhering to their strict rules, you can enhance your trading strategy and gain a deeper understanding of market dynamics. However, like any trading tool, harmonic patterns require practice, discipline, and effective risk management to achieve consistent success.
Whether you’re a beginner or an experienced trader, incorporating harmonic patterns into your trading arsenal can provide a significant edge in the competitive world of forex markets.