

In the dynamic and ever-changing world of forex trading, identifying market turning points is a critical skill that can significantly improve trading performance. A turning point marks the moment when a currency pair reverses its direction or changes its trend, presenting opportunities for traders to enter or exit positions effectively. This blog explores the key methods and strategies for identifying forex market turning points, enabling traders to make more informed decisions.
What Are Forex Market Turning Points?
Market turning points occur when the price of a currency pair shifts direction. These moments can represent the start of a new trend, the end of a correction, or a consolidation phase before a breakout. Recognizing these points early can provide traders with better entry and exit opportunities, enhancing their profitability.
Turning points generally fall into two categories:
- Reversal Points:
- The market changes from an uptrend to a downtrend or vice versa.
- Continuation Points:
- The market temporarily pauses before resuming its existing trend.
Why Identifying Turning Points Is Important
Understanding and identifying turning points can:
- Enhance Timing: Enable traders to enter or exit trades at optimal levels.
- Reduce Risk: Help set more accurate stop-loss and take-profit levels.
- Maximize Profits: Allow traders to capture the majority of a trend or reversal.
- Improve Strategy Execution: Offer a clearer understanding of market dynamics, leading to better decision-making.
Methods for Identifying Market Turning Points
1. Technical Analysis
Technical analysis is a cornerstone of forex trading and a powerful tool for spotting turning points. Key techniques include:
a. Support and Resistance Levels
- Identify areas where price frequently reverses. These levels act as barriers that price struggles to break through.
- Look for historical patterns where the price bounced or reversed near these levels.
b. Trendlines
- Draw trendlines connecting higher lows in an uptrend or lower highs in a downtrend. A break of these trendlines often signals a turning point.
c. Candlestick Patterns
- Candlestick formations, such as pin bars, engulfing patterns, and dojis, often appear at turning points and provide visual cues for potential reversals.
d. Chart Patterns
- Recognize patterns like double tops, double bottoms, head and shoulders, and triangles, which often signal reversals or continuations.
2. Indicators and Oscillators
Indicators provide a quantitative approach to identifying turning points. Some of the most effective ones include:
a. Moving Averages
- Crossovers between short-term and long-term moving averages can indicate trend changes.
- Use moving average convergence-divergence (MACD) to identify momentum shifts.
b. Relative Strength Index (RSI)
- RSI highlights overbought or oversold conditions. When RSI crosses above or below certain levels (e.g., 70 or 30), it may indicate a potential reversal.
c. Bollinger Bands
- Price moving outside the Bollinger Bands often precedes a reversal, as markets tend to revert to the mean.
d. Fibonacci Retracements
- Use Fibonacci levels (e.g., 38.2%, 50%, 61.8%) to identify potential turning points during corrections or pullbacks.
3. Price Action Analysis
Price action analysis involves studying raw price movements without relying heavily on indicators. Techniques include:
a. Swing Highs and Lows
- Identify higher highs and higher lows in an uptrend or lower highs and lower lows in a downtrend. A break in this sequence often signals a turning point.
b. Volume Analysis
- Increased volume during a price reversal can confirm the validity of the turning point.
c. Pivot Points
- Use pivot point calculations to identify potential reversal zones in intraday trading.
4. Fundamental Analysis
Economic events and news releases can also create market turning points. Monitor:
- Interest Rate Decisions: Changes in interest rates can trigger significant trend shifts.
- Economic Data Releases: Employment reports, GDP figures, and inflation data often lead to turning points.
- Geopolitical Events: Political instability, trade agreements, or natural disasters can create abrupt market reversals.
5. Sentiment Analysis
Market sentiment reflects the collective mood of traders and investors. Extreme levels of bullish or bearish sentiment often precede turning points:
- Use tools like the Commitment of Traders (COT) report to gauge market positioning.
- Monitor social media, news, and trading forums to assess crowd sentiment.
Combining Methods for Greater Accuracy
No single method is foolproof. Combining multiple approaches can increase the reliability of identifying turning points. For example:
- Use support and resistance levels with candlestick patterns to confirm reversals.
- Combine RSI with trendlines to validate overbought or oversold signals.
- Incorporate economic data alongside technical indicators for a holistic view.
Practical Example: Identifying a Turning Point in EUR/USD
- Scenario:
- EUR/USD is in a downtrend, approaching a significant support level at 1.1000.
- Technical Analysis:
- A bullish pin bar forms at the support level, indicating a potential reversal.
- RSI shows oversold conditions, crossing back above 30.
- Fundamental Analysis:
- A dovish statement from the Federal Reserve suggests potential USD weakness.
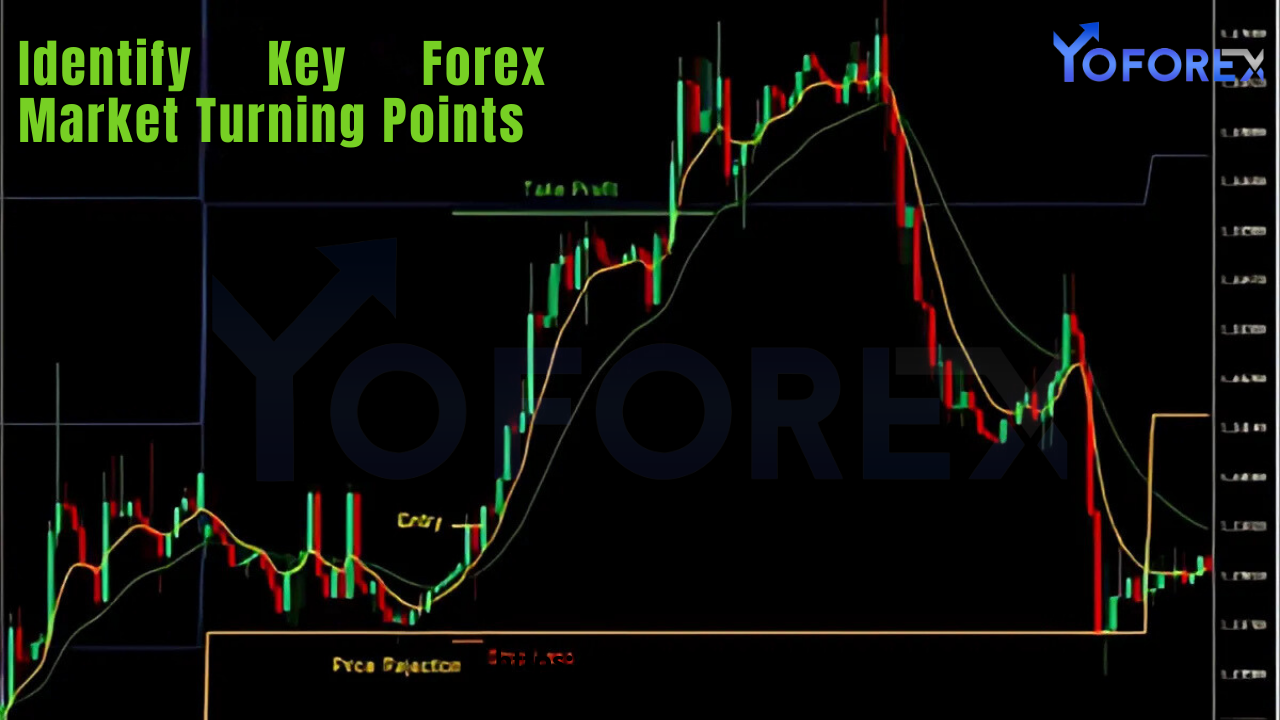
- Trade Execution:
- Enter a long position at 1.1020 with a stop-loss below the support level at 1.0950.
- Set a take-profit target at the next resistance level of 1.1200.
Common Mistakes When Identifying Turning Points
- Overtrading:
- Mistaking every small movement for a turning point can lead to unnecessary trades.
- Ignoring Context:
- Always consider the broader trend and market structure before acting on potential signals.
- Lack of Confirmation:
- Entering trades without confirming signals from multiple methods increases the risk of false reversals.
- Poor Risk Management:
- Failing to set proper stop-loss levels can lead to significant losses if the market moves against you.
Tips for Success
- Stay Patient:
- Wait for clear signals and avoid chasing the market.
- Use a Trading Plan:
- Define entry, exit, and risk management rules before executing trades.
- Backtest Your Strategy:
- Test your turning point identification methods on historical data to evaluate their effectiveness.
- Keep Learning:
- Stay updated on new techniques and tools for analyzing market turning points.
Conclusion
Identifying key forex market turning points is a valuable skill that requires a combination of technical, fundamental, and sentiment analysis. By understanding the factors that drive market reversals and using reliable tools and techniques, traders can enhance their decision-making and improve their trading outcomes.
Remember, practice and experience are essential for mastering this skill. Continuously refine your approach, stay disciplined, and adapt to changing market conditions to succeed in the challenging yet rewarding world of forex trading.