

In Forex trading, one of the most important aspects of technical analysis is identifying key levels. These levels are critical price points at which the market tends to react, either reversing direction or consolidating. Identifying these levels allows traders to make better-informed decisions about where to enter and exit trades, enhancing their ability to capitalize on market movements. Knowing how to identify key levels in Forex can be the difference between a winning trade and a missed opportunity.
In this blog post, we will explore how to identify key levels in Forex, why they are important, and how you can use these levels to improve your trade entries. Whether you are a beginner or an experienced trader, understanding key levels will give you an edge in navigating the Forex market.
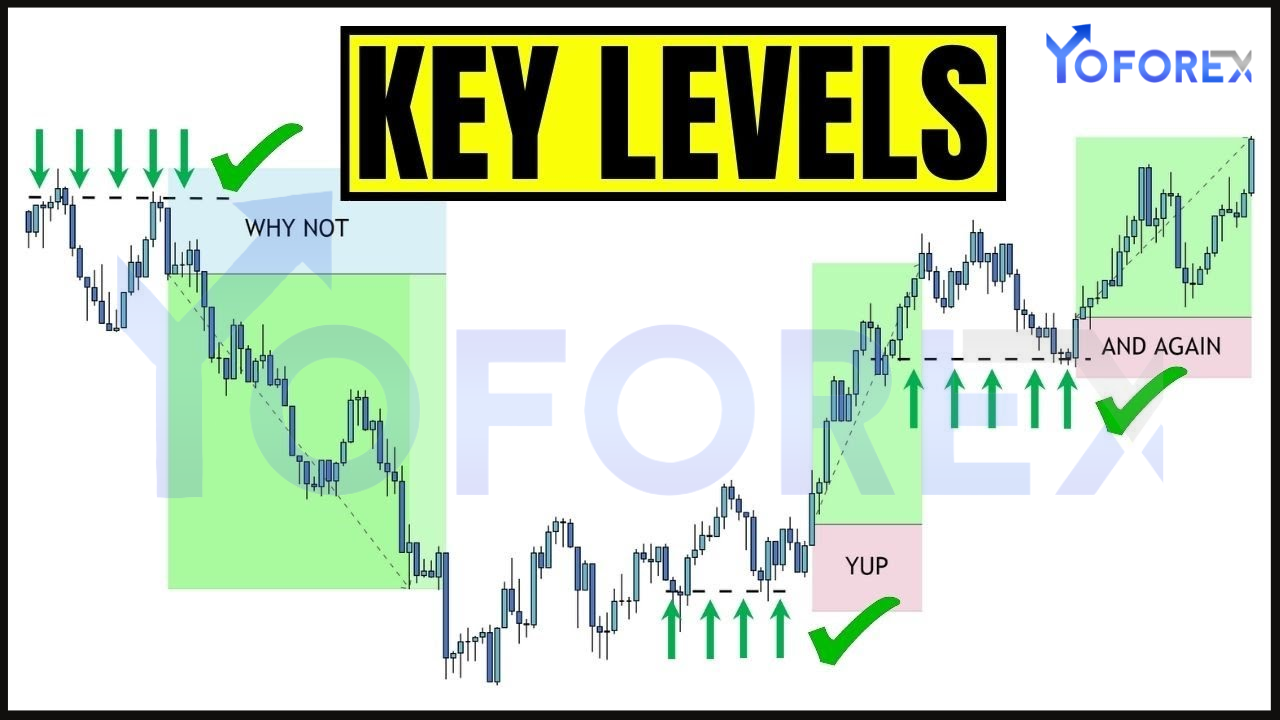
What Are Key Levels in Forex?
Key levels in Forex refer to specific price points on a currency pair’s chart where price tends to react, either by reversing direction or pausing for consolidation. These levels are derived from various types of support and resistance, and they represent areas where buyers and sellers have historically shown interest.
- Support: A support level is a price point where the market has consistently found demand, causing price to stop falling and potentially reverse higher. It represents the “floor” of the market.
- Resistance: A resistance level is a price point where the market has consistently faced selling pressure, causing price to stop rising and potentially reverse lower. It represents the “ceiling” of the market.
- Breakouts and Retests: When price breaks through support or resistance, the level is often considered breached, but it can later act as a new support or resistance in a retest.
- Pivot Points: Pivot points are calculated levels based on the previous day’s price action, commonly used to determine potential turning points during the trading day.
Key levels can be horizontal or dynamic (such as moving averages or trendlines). They can also appear at round numbers, which tend to attract attention due to their psychological importance in the market.
Why Key Levels Are Important in Forex Trading
Understanding and identifying key levels in Forex is essential for several reasons:
- Entry and Exit Points: Key levels help traders identify optimal entry and exit points. Buying near support or selling near resistance increases the likelihood of profitable trades, as these levels tend to influence price behavior.
- Risk Management: Traders can use key levels to define their stop-loss and take-profit levels. For instance, placing a stop-loss just below a support level or above a resistance level helps protect against breakouts.
- Market Psychology: Key levels often reflect areas where traders are most active. These levels represent zones of supply and demand, making them crucial for understanding market psychology and anticipating price reactions.
- Trend Confirmation: Key levels can also confirm whether the market is trending or in consolidation. If the price consistently respects support and resistance levels, it may indicate that the market is in a trending phase.
Types of Key Levels in Forex
- Horizontal Support and Resistance Levels
Horizontal support and resistance levels are the most basic form of key levels. They are drawn by identifying areas where price has reversed direction multiple times in the past.
- Support: When price approaches a support level and doesn’t break it, traders often view this as a potential buying opportunity, expecting the price to reverse higher.
- Resistance: When price approaches a resistance level and fails to break through, traders may look for selling opportunities, anticipating the price will reverse downward.
How to Identify Horizontal Levels: Look for areas where the price has repeatedly bounced off or reversed, leaving visible peaks (resistance) or troughs (support). These levels tend to be more significant if they have been tested multiple times.
- Trendlines and Channel Lines
Trendlines are another essential tool for identifying key levels. Trendlines are drawn by connecting the highs (in a downtrend) or lows (in an uptrend) of price action. These lines help identify dynamic support and resistance levels.
- Uptrend: In an uptrend, the trendline acts as support, where the price is likely to bounce higher when it approaches the trendline.
- Downtrend: In a downtrend, the trendline acts as resistance, where the price is likely to reverse downward when it approaches the trendline.
How to Identify Trendlines: Connect at least two significant points (such as the most recent swing lows or swing highs) with a line. The more times the price touches or approaches the trendline, the stronger the trendline becomes.
- Fibonacci Retracement Levels
Fibonacci retracement levels are widely used by traders to identify potential support and resistance levels based on key Fibonacci ratios (23.6%, 38.2%, 50%, 61.8%, and 100%). These levels are derived from the Fibonacci sequence and are believed to indicate areas where price may reverse or experience strong resistance or support.
How to Use Fibonacci Retracement: To draw Fibonacci retracement levels, identify a significant price swing (from a low to a high or vice versa), and then apply the Fibonacci tool to the chart. The tool will automatically generate retracement levels where price may potentially reverse.
- Round Numbers
Round numbers (such as 1.2000 in EUR/USD, or 100.00 in USD/JPY) are psychological levels that attract market attention. Traders often place stop orders or limit orders at these levels, leading to price reactions.
- Support at Round Numbers: If the price approaches a round number and bounces upward, it may act as support.
- Resistance at Round Numbers: If the price approaches a round number and struggles to break through, it may act as resistance.
How to Identify Round Numbers: Round numbers occur at any multiple of 100 or 1000, and they are often areas where traders will place their orders, leading to price reactions.
- Pivot Points
Pivot points are calculated based on the previous day’s price action and are used to identify potential turning points for the current day. They are especially useful for day traders looking to trade short-term trends. Pivot points consist of a central pivot, as well as support and resistance levels above and below the central pivot.
How to Use Pivot Points: Calculate the pivot point by averaging the high, low, and close prices of the previous day. The central pivot can be used as a baseline, with levels above and below representing potential support and resistance zones for the day.
How to Use Key Levels for Better Trade Entries
- Wait for Price to Approach Key Levels
Rather than chasing price as it moves, wait for price to approach a key level, such as support or resistance, and observe how it reacts. Look for signs of reversal patterns (e.g., candlestick patterns such as engulfing, pin bars, or doji) near these levels to confirm the price action and validate your entry.
- Combine Key Levels with Technical Indicators
To increase the reliability of your trade entries, combine key levels with technical indicators. For example, if price approaches a support level and the Relative Strength Index (RSI) is oversold, this could provide additional confirmation that the market is likely to reverse.
- Use Price Action at Key Levels
Price action is a powerful tool for understanding how the market reacts to key levels. Observe how the price behaves when it approaches a key level, paying attention to candlestick patterns, chart formations, and momentum. These can provide early signals of reversals or breakouts.
- Breakout Trading
In some cases, the price may break through key support or resistance levels, indicating a potential breakout. When this happens, traders can enter the market in the direction of the breakout, but it is important to wait for confirmation, such as a close beyond the key level and higher volume.
Tip: After a breakout, watch for a retest of the broken level. If the level now acts as support or resistance (depending on the direction of the breakout), this provides a more secure entry point.
- Use Stop-Loss Orders for Protection
Key levels are ideal for placing stop-loss orders. For example, if you enter a long position near support, place your stop-loss just below the support level to protect yourself in case the price breaks lower. Similarly, if you enter a short position near resistance, place your stop-loss just above the resistance level.
Conclusion: Mastering Key Levels for Better Trade Entries
Identifying key levels in the Forex market is crucial for making better trade entries and improving your overall trading strategy. By focusing on support and resistance, trendlines, Fibonacci retracements, round numbers, and pivot points, traders can significantly increase their chances of making profitable trades. Understanding how these levels impact price behavior allows traders to make more informed decisions, manage risk more effectively, and time their entries for optimal results.
Incorporating key levels into your trading plan, combined with sound risk management and patience, will help you navigate the complexities of the Forex market and achieve greater consistency in your trading. Whether you’re a beginner or an experienced trader, learning to recognize and act on these levels is a vital skill for long-term success.