

In forex trading, understanding overbought and oversold conditions can be a game-changer. These terms refer to market conditions where a currency pair is believed to be trading at a price that is too high (overbought) or too low (oversold) relative to its recent performance. Identifying these conditions helps traders anticipate potential reversals, enabling them to make informed trading decisions.
This blog will guide you through the concept of overbought and oversold conditions, the tools used to identify them, and strategies to leverage this knowledge effectively.
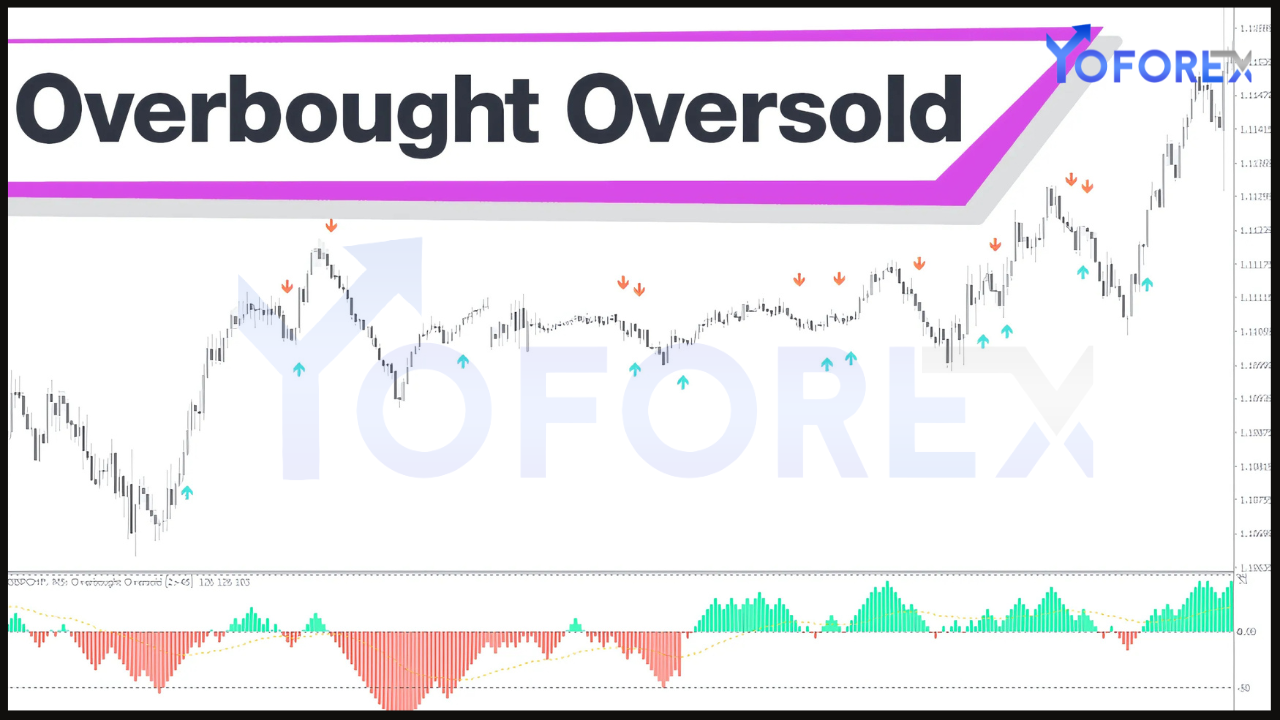
What Do Overbought and Oversold Mean?
Overbought:
An overbought condition occurs when a currency pair experiences a prolonged upward price movement, leading traders to believe it is overpriced and due for a correction or reversal. While overbought does not guarantee an immediate price drop, it signals potential weakness in the current trend.
Oversold:
An oversold condition arises when a currency pair undergoes a sustained downward price movement, suggesting it may be undervalued and due for a rebound. Like overbought conditions, oversold levels indicate potential exhaustion of the prevailing trend.
Why Are Overbought and Oversold Conditions Important?
- Trend Reversal Signals:
- These conditions often precede market reversals, allowing traders to enter or exit positions.
- Improved Timing:
- Recognizing overbought or oversold levels helps traders time their trades more effectively.
- Risk Management:
- Understanding these conditions enables traders to set more accurate stop-loss and take-profit levels.
- Market Sentiment Analysis:
- They reflect extreme buying or selling pressure, offering insights into market sentiment.
Tools to Identify Overbought and Oversold Conditions
Several technical indicators and tools can help traders identify these conditions. Here are some of the most popular ones:
1. Relative Strength Index (RSI)
- Description:
- The RSI is a momentum oscillator that measures the speed and change of price movements. It ranges from 0 to 100.
- Key Levels:
- Overbought: RSI above 70.
- Oversold: RSI below 30.
- How to Use:
- When RSI crosses above 70, consider it a signal to prepare for a potential price drop.
- When RSI crosses below 30, watch for a potential price rebound.
2. Stochastic Oscillator
- Description:
- This indicator compares a currency’s closing price to its price range over a specific period.
- Key Levels:
- Overbought: Above 80.
- Oversold: Below 20.
- How to Use:
- Look for crossovers between the %K and %D lines within these levels to confirm potential reversals.
3. Bollinger Bands
- Description:
- Bollinger Bands consist of a moving average and two standard deviation lines, forming an upper and lower band.
- Key Insights:
- Overbought: Price touches or exceeds the upper band.
- Oversold: Price touches or falls below the lower band.
- How to Use:
- Look for price action combined with candlestick patterns near the bands for confirmation.
4. Commodity Channel Index (CCI)
- Description:
- The CCI measures the deviation of price from its average price over a given period.
- Key Levels:
- Overbought: Above +100.
- Oversold: Below -100.
- How to Use:
- Use CCI levels in conjunction with trendlines or support/resistance levels for greater accuracy.
5. Moving Average Convergence Divergence (MACD)
- Description:
- While primarily used to identify trend strength, MACD divergence can signal overbought or oversold conditions.
- Key Insights:
- Overbought: When the MACD line moves significantly above the signal line and histogram widens.
- Oversold: When the MACD line drops significantly below the signal line and histogram widens.
Strategies for Trading Overbought and Oversold Conditions
Identifying overbought and oversold conditions is just the first step. Here are some strategies to trade these conditions effectively:
1. Reversal Trading
- How It Works:
- Enter trades in the opposite direction of the prevailing trend when overbought or oversold conditions are confirmed.
- Example:
- If RSI is above 70 and forms a bearish divergence, consider entering a short position.
2. Trend Continuation
- How It Works:
- Sometimes, overbought or oversold conditions indicate strong momentum rather than an imminent reversal.
- Example:
- If RSI remains above 70 during a strong uptrend, wait for a pullback to enter a long position.
3. Combine with Support and Resistance Levels
- How It Works:
- Use overbought/oversold signals in conjunction with key support or resistance levels to confirm trade setups.
- Example:
- If price reaches a resistance level and RSI is above 70, it strengthens the case for a reversal.
4. Divergence Trading
- How It Works:
- Look for divergences between price action and indicators like RSI or MACD.
- Example:
- If price makes higher highs but RSI forms lower highs, it indicates a bearish divergence and a potential reversal.
Risk Management in Overbought and Oversold Conditions
Trading based on overbought and oversold conditions involves risk. Here’s how to manage it:
- Set Stop-Loss Orders:
- Place stop-loss orders above recent highs for short trades or below recent lows for long trades.
- Use Position Sizing:
- Limit the amount of capital you risk on each trade to 1-2% of your account balance.
- Avoid Overtrading:
- Not all overbought or oversold signals result in successful trades. Focus on high-probability setups.
- Combine Multiple Indicators:
- Use multiple tools to confirm overbought/oversold conditions rather than relying on a single indicator.
Common Mistakes to Avoid
- Relying Solely on One Indicator:
- Combine indicators with price action and market context for better accuracy.
- Ignoring Market Trends:
- Overbought and oversold signals are less reliable in strong trending markets.
- Entering Trades Too Early:
- Wait for confirmation signals to avoid premature entries.
- Neglecting Fundamental Analysis:
- Economic events and news releases can override technical signals.
Practical Example
Scenario:
- Currency Pair: EUR/USD
- Timeframe: 1-hour chart
- Indicators Used: RSI and Bollinger Bands
- Observation:
- RSI crosses above 70, and the price touches the upper Bollinger Band.
- Confirmation:
- A bearish engulfing candlestick forms near the upper band.
- Trade Execution:
- Enter a short position with a stop-loss above the recent high.
- Outcome:
- The price reverses and moves downward, hitting the take-profit target.
Conclusion
Identifying overbought and oversold conditions in forex trading can provide valuable insights into market dynamics and potential reversals. By using tools like RSI, Stochastic Oscillator, Bollinger Bands, and CCI, traders can make informed decisions and improve their trading accuracy.
However, no indicator is foolproof. Always combine technical analysis with sound risk management and an understanding of market context to maximize your success in forex trading.