

Candlestick patterns are an essential tool for traders and investors seeking to navigate the dynamic world of financial markets. These visual representations of price movements provide critical insights into market sentiment, potential reversals, and continuation patterns, helping traders make informed decisions. In this blog, we will delve into the fundamentals of candlestick patterns, their significance, and how they can inform trading strategies.
What Are Candlestick Patterns?
Candlestick patterns are graphical representations of price action over a specific time frame. Each candlestick reflects four key data points:
- Open: The price at which the trading session began.
- High: The highest price reached during the session.
- Low: The lowest price reached during the session.
- Close: The price at which the trading session ended.
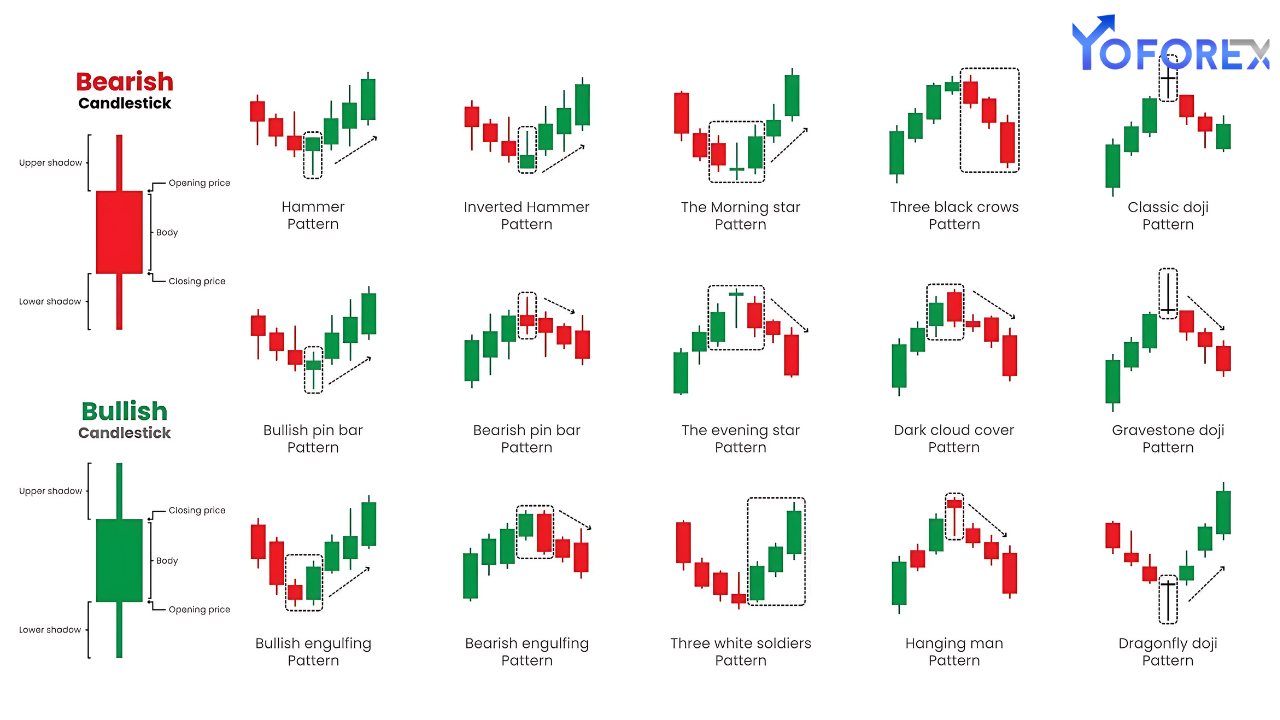
A candlestick consists of two main parts:
- Body: The area between the open and close prices, which indicates the price range during the session.
- Wicks (or Shadows): The lines extending from the body, representing the high and low prices.
Candlesticks can be either bullish (indicating price increases) or bearish (indicating price decreases), typically represented in green/white and red/black colors, respectively.
Why Are Candlestick Patterns Important?
- Visual Representation of Market Sentiment:
- Candlestick patterns encapsulate the battle between buyers and sellers, offering a snapshot of market psychology.
- Identifying Trends:
- Patterns can indicate whether the market is in an uptrend, downtrend, or consolidation phase.
- Predicting Potential Reversals:
- Certain patterns signal the likelihood of a trend reversal, allowing traders to enter or exit positions strategically.
- Enhancing Risk Management:
- By identifying key levels of support and resistance, candlestick patterns help traders manage risk effectively.
Key Candlestick Patterns for Trading
Candlestick patterns fall into two main categories: reversal patterns and continuation patterns. Below are some of the most widely recognized patterns:
1. Reversal Patterns
Reversal patterns indicate a potential change in the market’s direction. These include:
a) Hammer and Inverted Hammer:
- Hammer: A bullish reversal pattern that occurs after a downtrend, characterized by a small body and a long lower wick.
- Indication: Buyers are gaining control after significant selling pressure.
- Inverted Hammer: A bullish reversal pattern with a small body and a long upper wick, signaling a potential shift in sentiment.
- Indication: Sellers are losing momentum.
b) Shooting Star and Hanging Man:
- Shooting Star: A bearish reversal pattern with a small body and a long upper wick, appearing after an uptrend.
- Indication: Buyers are losing strength, and selling pressure is increasing.
- Hanging Man: A bearish reversal pattern with a small body and a long lower wick, signaling a potential downtrend.
- Indication: Sellers are gaining momentum after a period of buying.
c) Engulfing Patterns:
- Bullish Engulfing: A large bullish candle fully engulfs the preceding smaller bearish candle, signaling a potential upward reversal.
- Indication: Buyers are overpowering sellers.
- Bearish Engulfing: A large bearish candle engulfs a smaller bullish candle, indicating a downward reversal.
- Indication: Sellers are taking control.
d) Morning Star and Evening Star:
- Morning Star: A three-candle bullish reversal pattern that includes a bearish candle, a small indecisive candle, and a large bullish candle.
- Indication: A transition from selling to buying.
- Evening Star: A three-candle bearish reversal pattern with a bullish candle, a small indecisive candle, and a large bearish candle.
- Indication: A shift from buying to selling.
2. Continuation Patterns
Continuation patterns suggest that the existing trend is likely to persist. These include:
a) Doji:
- A candlestick with nearly equal open and close prices, resulting in a cross-like appearance.
- Indication: Market indecision, often followed by a continuation of the existing trend.
b) Marubozu:
- A candlestick with no wicks indicates strong momentum in the trend direction.
- Indication: Bulls or bears are firmly in control, and the trend is likely to continue.
c) Three White Soldiers and Three Black Crows:
- Three White Soldiers: A bullish continuation pattern with three consecutive long bullish candles.
- Indication: Strong upward momentum.
- Three Black Crows: A bearish continuation pattern with three consecutive long bearish candles.
- Indication: Persistent downward pressure.
d) Rising and Falling Three Methods:
- Rising Three Methods: A bullish continuation pattern with a long bullish candle, followed by small bearish candles, and another long bullish candle.
- Indication: Consolidation before the uptrend resumes.
- Falling Three Methods: A bearish continuation pattern with a long bearish candle, small bullish candles, and another long bearish candle.
- Indication: A pause before the downtrend continues.
How to Use Candlestick Patterns in Trading
- Combine with Other Indicators:
- Use candlestick patterns alongside technical indicators like moving averages, RSI, or MACD to confirm signals.
- Identify Key Levels:
- Focus on candlestick patterns forming near support and resistance levels for higher probability trades.
- Time Frame Matters:
- Candlestick patterns on higher time frames (e.g., daily or weekly) often provide more reliable signals compared to lower time frames (e.g., 5-minute or 15-minute).
- Avoid Overreliance:
- While candlestick patterns are powerful, they should not be the sole basis for trading decisions. Always consider the broader market context.
- Practice Patience:
- Wait for patterns to complete before making a move. Acting prematurely can lead to losses.
Common Mistakes to Avoid
- Ignoring the Trend:
- Candlestick patterns are most effective when used in conjunction with the prevailing trend. Avoid using reversal patterns in strong trending markets without confirmation.
- Overtrading:
- Not every candlestick pattern warrants a trade. Focus on high-probability setups.
- Neglecting Risk Management:
- Always use stop-loss orders to protect against unexpected market moves.
- Misinterpreting Patterns:
- Ensure a proper understanding of pattern characteristics to avoid misreading market signals.
Conclusion
Candlestick patterns are a timeless tool for traders, offering a wealth of information about market sentiment and potential price movements. By mastering these patterns and integrating them into a broader trading strategy, you can make more informed decisions and improve your chances of success in the markets. However, always remember that no single tool guarantees success. Combining candlestick analysis with other techniques and maintaining disciplined risk management is the key to long-term trading success.