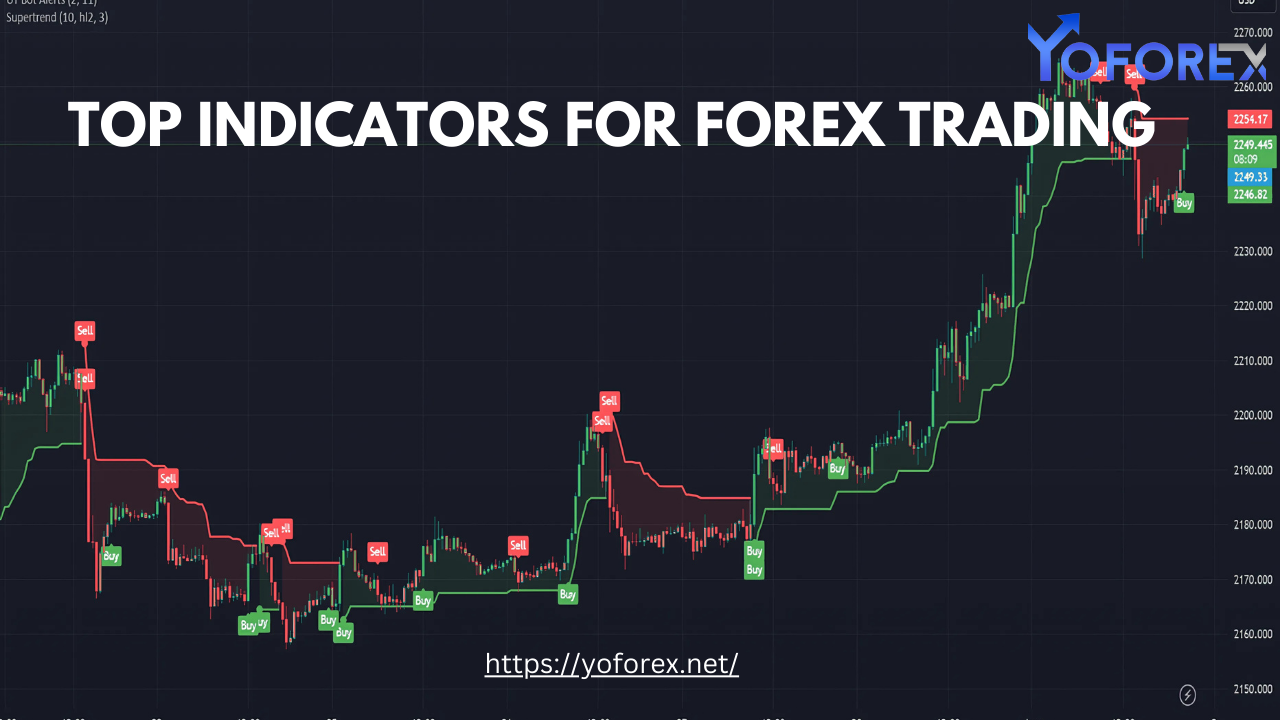
Forex trading is a dynamic market that requires precision, analysis, and the right set of tools to succeed. One of the most powerful tools available to traders is the use of technical indicators. These indicators are essential for analyzing price movements, predicting trends, and making informed trading decisions. In this guide, we’ll explore the top indicators for Forex trading and how you can use them to enhance your MetaTrader experience.

What Are Forex Trading Indicators?
Forex trading indicators are mathematical calculations based on the price, volume, or open interest of a currency pair. They provide traders with insights into market trends, momentum, volatility, and other critical factors. Indicators are widely used in trading platforms like MetaTrader 4 and MetaTrader 5, making them accessible to both novice and experienced traders.
By integrating these indicators into your trading strategy, you can:
- Identify entry and exit points.
- Confirm market trends.
- Detect overbought or oversold conditions.
- Manage risks effectively.
1. Moving Averages (MA)
Overview: Moving averages are among the most commonly used indicators in Forex trading. They smooth out price data to identify the direction of the trend over a specific period.
Types:
- Simple Moving Average (SMA): Averages the closing prices over a set period.
- Exponential Moving Average (EMA): Places more weight on recent prices, making it more responsive to changes.
How to Use:
- Look for crossovers between shorter and longer moving averages (e.g., a 50-day SMA crossing above the 200-day SMA indicates a bullish trend).
- Use as dynamic support and resistance levels.
2. Relative Strength Index (RSI)
Overview: RSI is a momentum oscillator that measures the speed and change of price movements. It ranges from 0 to 100 and is used to identify overbought or oversold conditions.
How to Use:
- RSI above 70 indicates overbought conditions, suggesting a potential price reversal.
- RSI below 30 indicates oversold conditions, signaling a potential buying opportunity.
- Look for divergence between RSI and price for trend reversals.
3. Bollinger Bands
Overview: Bollinger Bands consist of three lines: a moving average (middle band) and two standard deviation bands (upper and lower). These bands adjust to market volatility.
How to Use:
- When prices touch the upper band, the market may be overbought.
- When prices touch the lower band, the market may be oversold.
- Squeezes (narrowing of bands) often precede significant price movements.
4. Moving Average Convergence Divergence (MACD)
Overview: MACD is a trend-following indicator that shows the relationship between two moving averages. It also includes a histogram to gauge momentum.
How to Use:
- Crossovers between the MACD line and the signal line indicate buy or sell signals.
- The divergence between MACD and price can signal potential trend reversals.
- Use histogram bars to identify the strength of momentum.
5. Fibonacci Retracement
Overview: Fibonacci retracement levels are horizontal lines that indicate potential support and resistance levels based on the Fibonacci sequence.
How to Use:
- Identify significant price swings (highs and lows) to draw retracement levels.
- Common levels are 23.6%, 38.2%, 50%, 61.8%, and 78.6%.
- Use retracement levels to find potential entry points during pullbacks.
6. Stochastic Oscillator
Overview: The stochastic oscillator compares a currency pair’s closing price to its price range over a given period. It provides signals of overbought or oversold conditions.
How to Use:
- A reading above 80 suggests overbought conditions.
- A reading below 20 indicates oversold conditions.
- Look for crossovers of the %K and %D lines for buy or sell signals.
7. Average True Range (ATR)
Overview: ATR measures market volatility by calculating the average range of price movements over a specified period.
How to Use:
- Use ATR to set stop-loss levels based on market volatility.
- Higher ATR values indicate more volatile markets, while lower values suggest stable markets.
8. Ichimoku Cloud
Overview: The Ichimoku Cloud is a comprehensive indicator that identifies trends, support and resistance levels, and momentum.
Components:
- Tenkan-sen: Short-term trend line.
- Kijun-sen: Medium-term trend line.
- Senkou Span A & B: Form the cloud.
- Chikou Span: Lagging line.
How to Use:
- The price above the cloud indicates a bullish trend; the price below the cloud suggests a bearish trend.
- The thickness of the cloud represents market volatility.
- Crossovers between the Tenkan-sen and Kijun-sen provide entry and exit signals.
Enhancing Your MetaTrader Experience
MetaTrader platforms are equipped with a wide range of built-in indicators and allow traders to customize or add external indicators. Here are some tips to maximize your trading experience:
- Customize Your Chart Layout:
- Use templates to save your preferred indicator settings.
- Experiment with different timeframes and combinations of indicators to find what works best for your strategy.
- Leverage Automated Trading:
- MetaTrader supports Expert Advisors (EAs), which automate trading strategies based on your chosen indicators.
- Backtest Your Strategy:
- Use historical data in MetaTrader to test the effectiveness of your indicators and trading strategies.
- Stay Updated:
- Visit YoForex.net for the latest tools, tips, and strategies to enhance your Forex trading journey. The site provides valuable resources and insights tailored for traders of all levels.
Choosing the Right Indicators
While the indicators listed above are powerful, it’s crucial to understand that no single indicator guarantees success. The key is to combine indicators to confirm signals and build a robust trading strategy. For instance:
- Pair RSI with Bollinger Bands to identify strong entry and exit points.
- Use Fibonacci retracement with moving averages to pinpoint support and resistance levels.
Conclusion
Forex trading indicators are indispensable tools for analyzing the market and making informed decisions. Whether you’re a beginner or an experienced trader, incorporating the right indicators into your strategy can significantly enhance your performance on platforms like MetaTrader.
For more in-depth guidance, tutorials, and resources, explore YoForex.net. With the right tools and knowledge, you can navigate the Forex market with confidence and precision.
Stay Updated & Download: https://yoforex.net/top-indicators-for-forex-trading/

