

Pivot points are one of the most popular and useful tools in technical analysis, particularly in Forex trading. They help traders identify potential turning points in the market, acting as support and resistance levels that can guide entry and exit decisions. Pivot points are based on the previous day’s high, low, and close prices, offering a quick and efficient way to forecast where price might react during the trading day.
In this blog post, we will explore what pivot points are, how they are calculated, and how you can use them effectively in your Forex trading strategy. By the end of this article, you will have a solid understanding of how to incorporate pivot points into your trading plan for more informed decision-making.
What are Pivot Points?
A pivot point is a technical indicator used to determine the overall market trend for the day. It is based on the previous day’s price action and is used to calculate a series of support and resistance levels that help traders anticipate the market’s direction and potential reversals.
Pivot points are particularly useful for day traders and intraday traders because they are calculated using the previous day’s high, low, and close prices, and they provide clear, actionable levels for the current trading day. These points act as psychological levels for traders, where price tends to reverse or consolidate.
How are Pivot Points Calculated?
The standard pivot point formula uses the previous day’s high, low, and close prices to determine the pivot point and the associated support and resistance levels.
- Pivot Point (PP):
PP=High+Low+Close3PP = frac{High + Low + Close}{3} - First Support Level (S1):
S1=(2×PP)−HighS1 = (2 times PP) – High - First Resistance Level (R1):
R1=(2×PP)−LowR1 = (2 times PP) – Low - Second Support Level (S2):
S2=PP−(High−Low)S2 = PP – (High – Low) - Second Resistance Level (R2):
R2=PP+(High−Low)R2 = PP + (High – Low) - Third Support Level (S3):
S3=Low−2×(High−PP)S3 = Low – 2 times (High – PP) - Third Resistance Level (R3):
R3=High+2×(PP−Low)R3 = High + 2 times (PP – Low)
The pivot point (PP) itself is the most important level, and the support and resistance levels act as the potential zones where price may reverse or break through.
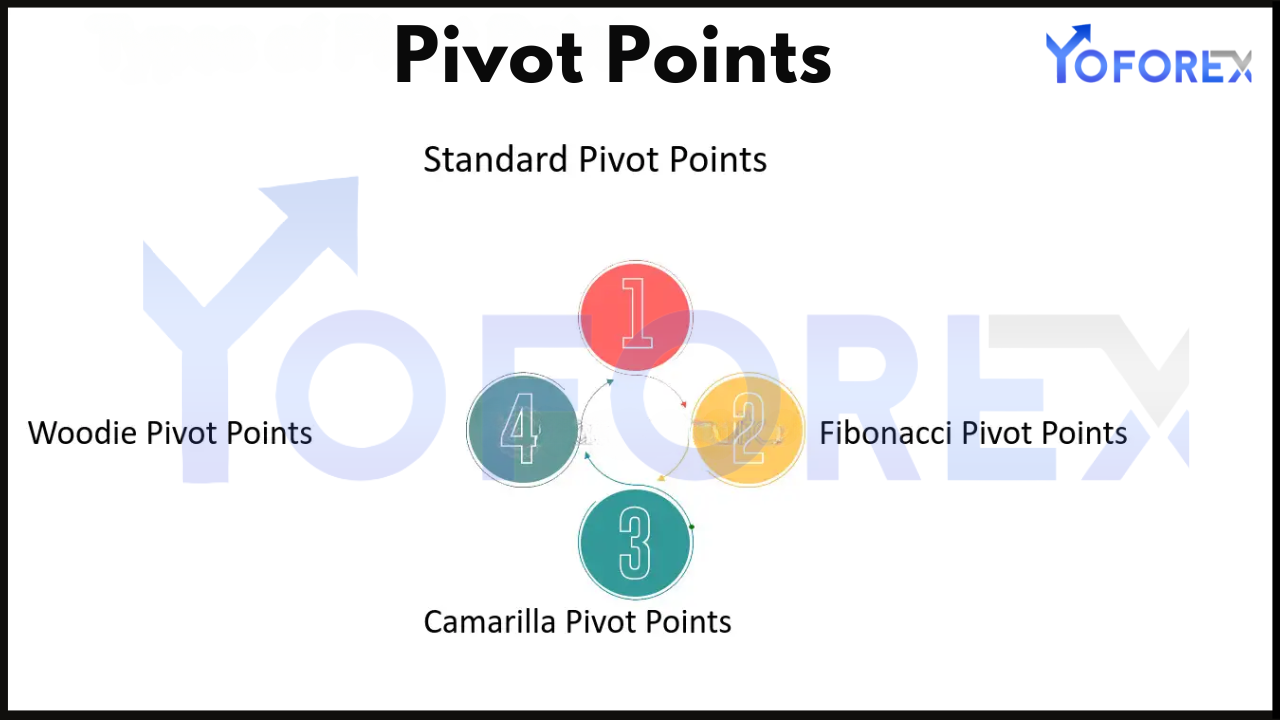
Types of Pivot Points
There are several variations of pivot points, and the standard version is just one type. Other popular types include:
- Fibonacci Pivot Points:
This variation of the pivot point incorporates Fibonacci retracement levels to calculate support and resistance levels, providing a more dynamic approach to identifying potential turning points in the market. - Woodie’s Pivot Points:
This method uses a different formula for calculating the pivot point but is similar to the standard method. It gives more weight to the most recent close and places less importance on the high and low. - Camarilla Pivot Points:
The Camarilla method places more emphasis on the range of the previous day’s price action. It uses a different set of support and resistance levels to provide more specific price levels for intraday trading.
Each type of pivot point has its strengths, and the choice of which to use will depend on your trading style, strategy, and market conditions.
How to Use Pivot Points in Forex Trading
- Determine Market Trend Using the Pivot Point
The pivot point itself is an excellent tool for gauging the market’s overall trend for the day. Traders typically use the following rules:
- If the price is above the pivot point (PP): The market is considered bullish. Traders will look for buying opportunities, particularly near support levels.
- If the price is below the pivot point (PP): The market is considered bearish. Traders will look for selling opportunities, particularly near resistance levels.
- If the price is near the pivot point (PP): The market is considered neutral. In this case, price may consolidate, and traders should wait for price action to show signs of direction before entering a trade.
Using the pivot point as a reference, traders can adjust their strategy to align with the market’s overall bias for the day.
- Using Support and Resistance Levels
The primary use of pivot points is to identify support and resistance levels. These levels act as potential reversal points where the market may change direction. Traders can use them to enter and exit positions effectively.
- Support Levels: If the price is approaching a support level (such as S1, S2, or S3), traders might consider buying, especially if price shows signs of reversing or consolidating. A strong reaction at support levels can indicate a potential move higher.
- Resistance Levels: If the price is approaching a resistance level (such as R1, R2, or R3), traders might consider selling, especially if price shows signs of rejection at these levels. A failure to break resistance may lead to a downward move.
Example: If EUR/USD is trading above the pivot point and approaches the first resistance level (R1), traders may anticipate a price rejection at R1 and look to sell. Conversely, if the pair is below the pivot point and approaches the first support level (S1), traders might look for a buy signal.
- Breakouts and Trend Continuation
When price breaks above a resistance level or below a support level, it can signal a trend continuation or breakout. Traders can use pivot points to identify these breakout opportunities.
- Bullish Breakout: If the price breaks above a resistance level (for example, R1 or R2), it suggests that the uptrend may continue. Traders may enter a long position and target the next resistance level.
- Bearish Breakout: If the price breaks below a support level (for example, S1 or S2), it suggests that the downtrend may continue. Traders may enter a short position and target the next support level.
Example: If the USD/JPY breaks above the R2 resistance level, traders might look for a continuation of the uptrend and enter a buy position, setting their target at R3 or higher.
- Reversal Trades at Key Levels
Pivot points can also be used for reversal trading, where traders look for price action at key support or resistance levels to signal a potential reversal. This strategy works best when the market is at overbought or oversold levels, indicated by price touching the upper or lower bands of the pivot points.
Example: If GBP/USD approaches S2 and shows signs of a reversal, such as a candlestick pattern like a pin bar or engulfing pattern, traders may consider entering a buy position at S2, targeting the pivot point or higher resistance levels.
- Using Pivot Points with Other Indicators
While pivot points are a powerful tool on their own, combining them with other technical indicators can help increase the accuracy of trade signals. Here are some ways to combine pivot points with other tools:
- RSI (Relative Strength Index): If the price approaches a pivot point or key level and the RSI is showing overbought or oversold conditions, it may confirm a potential reversal.
- Moving Averages: If the price is approaching a pivot level and is also aligned with a moving average (such as the 50-period or 200-period moving average), it may signal a strong support or resistance zone.
- MACD (Moving Average Convergence Divergence): Combining pivot points with MACD can help traders confirm trends and reversals. A bullish crossover near a support level, or a bearish crossover near a resistance level, can increase the probability of success.
Conclusion: Mastering Pivot Points for Better Forex Trading
Pivot points are an essential tool for day traders and intraday traders looking to identify key price levels, anticipate potential reversals, and make better trading decisions. By understanding how to calculate and use pivot points effectively, traders can enhance their ability to spot entry and exit points, manage risk, and optimize their strategies.
To trade Forex using pivot points effectively, remember to consider the broader market trend, use pivot points as reference levels for support and resistance, and combine them with other technical indicators to increase the accuracy of your trades. With practice and a disciplined approach, pivot points can become a powerful part of your Forex trading strategy, helping you make more informed decisions and improve your profitability.