

Divergence is a powerful concept in forex trading that helps traders identify potential trend reversals or continuations by analyzing the relationship between price movement and an oscillator. By spotting divergences between price action and indicators like the Relative Strength Index (RSI), Moving Average Convergence Divergence (MACD), or Stochastic Oscillator, traders can gain valuable insights into market momentum and use these signals to inform their trades.
In this blog, we’ll explore the concept of divergence, its types, how to use it as a forex trading signal, and practical strategies to incorporate divergence into your trading approach.
What is Divergence in Forex Trading?
Divergence occurs when the price of a currency pair moves in one direction, while a technical indicator moves in the opposite direction. This discrepancy often signals a shift in market momentum, providing clues about potential reversals or continuations.
Key Concept:
Divergence suggests that the current price trend may be weakening, even if the trend itself hasn’t yet reversed.
Types of Divergence
Divergence is categorized into two main types: regular divergence and hidden divergence. Each type has bullish and bearish variations.
1. Regular Divergence
Regular divergence signals a potential trend reversal.
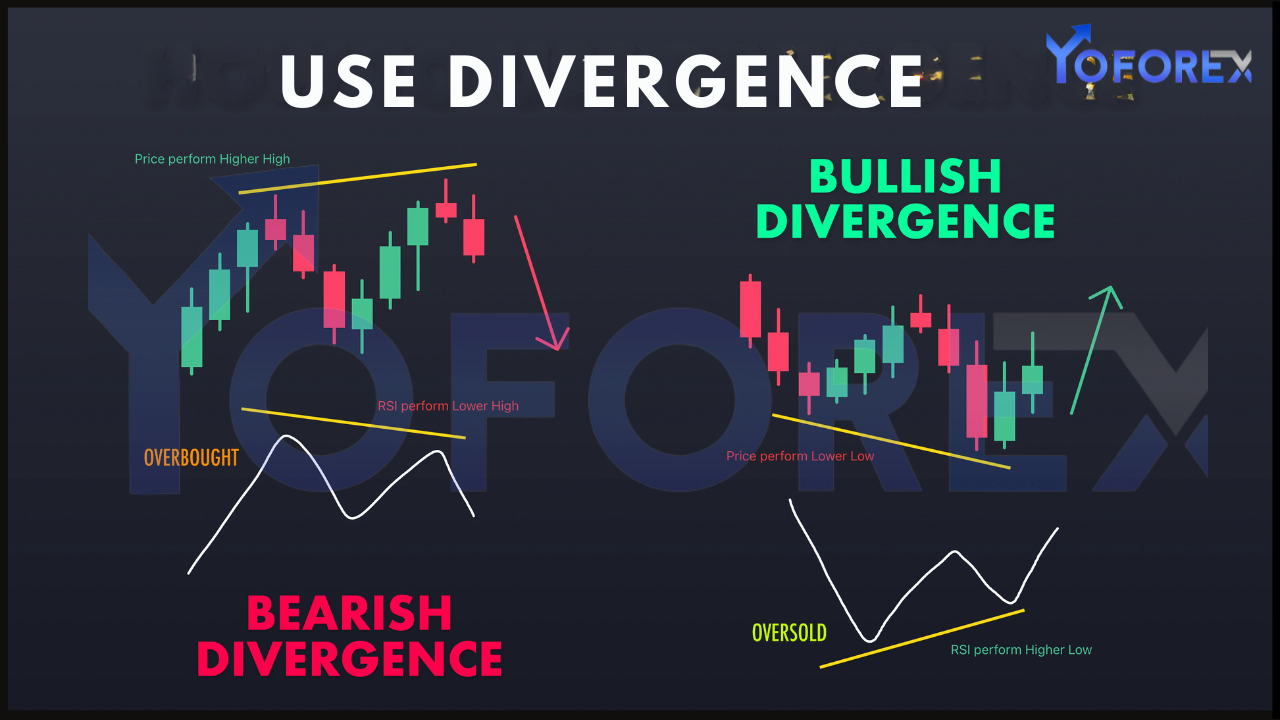
- Bullish Regular Divergence:
- Occurs when price makes a lower low, but the oscillator makes a higher low.
- Suggests that bearish momentum is weakening and a bullish reversal may occur.
- Example: Price is in a downtrend but RSI or MACD shows higher lows.
- Bearish Regular Divergence:
- Occurs when price makes a higher high, but the oscillator makes a lower high.
- Indicates weakening bullish momentum and a possible bearish reversal.
- Example: Price is in an uptrend but the Stochastic Oscillator shows lower highs.
2. Hidden Divergence
Hidden divergence signals a potential trend continuation.
- Bullish Hidden Divergence:
- Occurs when price makes a higher low, but the oscillator makes a lower low.
- Indicates that the uptrend is likely to continue.
- Example: In an uptrend, price retraces but maintains higher lows, while RSI shows lower lows.
- Bearish Hidden Divergence:
- Occurs when price makes a lower high, but the oscillator makes a higher high.
- Suggests that the downtrend is likely to continue.
- Example: In a downtrend, price retraces but maintains lower highs, while MACD shows higher highs.
Indicators Commonly Used for Divergence
1. Relative Strength Index (RSI)
RSI measures the strength of price movements. Divergence on RSI often signals overbought or oversold conditions.
2. Moving Average Convergence Divergence (MACD)
MACD analyzes momentum and trend direction. Divergences between MACD lines and price are particularly reliable.
3. Stochastic Oscillator
The Stochastic Oscillator identifies overbought and oversold zones, making it useful for spotting divergence during ranging markets.
4. On-Balance Volume (OBV)
OBV measures volume flow, and divergence here can indicate a lack of support for the current price trend.
How to Use Divergence as a Forex Trading Signal
1. Spot the Divergence
- Identify potential divergences by comparing price action with your chosen indicator.
- Look for discrepancies between the highs and lows of price and the indicator.
Example:
In an uptrend, if the price makes a higher high but RSI makes a lower high, a bearish divergence is forming.
2. Confirm the Divergence
- Use additional indicators or tools to confirm divergence signals.
- Combine divergence with candlestick patterns, support/resistance levels, or trendlines.
Example:
If a bearish divergence aligns with a double top pattern, it strengthens the likelihood of a reversal.
3. Enter the Trade
- For Regular Divergence: Enter a reversal trade once divergence is confirmed.
- For Hidden Divergence: Enter a continuation trade in the direction of the trend.
Tip: Wait for confirmation signals, such as a breakout or strong candlestick pattern, before entering.
4. Set Stop-Loss and Take-Profit Levels
- Place your stop-loss beyond the recent swing high or low to minimize risk.
- Set take-profit levels based on Fibonacci retracement levels, support/resistance zones, or a fixed risk-reward ratio.
Example:
For a bullish divergence trade, place the stop-loss below the recent swing low and target the next resistance level.
Trading Strategies Using Divergence
1. Regular Divergence for Reversal Trading
- Use regular divergence to identify potential trend reversals.
- Combine with other reversal signals, such as doji or engulfing candlesticks.
Example:
If a bearish divergence occurs near a key resistance level and forms a shooting star candlestick, it’s a strong reversal signal.
2. Hidden Divergence for Trend Continuation
- Use hidden divergence to identify retracement entries in trending markets.
- Combine with trendlines or moving averages to confirm continuation.
Example:
In an uptrend, a bullish hidden divergence aligns with the 50-day moving average, signaling a continuation of the trend.
3. Divergence and Breakouts
- Use divergence to anticipate breakouts from consolidation patterns like triangles or rectangles.
- Enter when price breaks out in the direction indicated by the divergence.
Example:
A bullish divergence occurs during a descending triangle pattern. Enter a buy trade once price breaks above the triangle resistance.
Advantages of Using Divergence
- Early Signal: Divergence often provides early warning of trend changes.
- Versatility: Works in both trending and ranging markets.
- Confirmation Tool: Adds confidence to other technical analysis methods.
- Risk Management: Helps set logical stop-loss and take-profit levels.
Limitations of Using Divergence
- False Signals: Not all divergences result in reversals or continuations.
- Subjectivity: Identifying divergence requires experience and can be prone to interpretation errors.
- Lagging Nature: Indicators may lag behind price, resulting in delayed signals.
Tip: Always confirm divergence signals with additional analysis and risk management.
Practical Tips for Trading Divergence
- Use Multiple Timeframes: Check for divergence on higher timeframes for stronger signals.
- Combine with Other Indicators: Use moving averages, Fibonacci retracements, or pivot points for additional confirmation.
- Practice on a Demo Account: Gain confidence in spotting and trading divergence without risking real money.
- Avoid Overcomplicating: Focus on clear divergences to avoid analysis paralysis.
Common Mistakes to Avoid
- Overtrading Divergences: Not all divergences are tradable. Focus on high-probability setups.
- Ignoring Context: Always consider the overall market structure and trend before acting on divergence signals.
- Relying Solely on Divergence: Use divergence as part of a broader trading strategy, not in isolation.
Conclusion
Divergence is a valuable tool for forex traders, offering insights into potential reversals and trend continuations. By understanding the types of divergence, using reliable indicators, and combining signals with other analysis methods, traders can enhance their decision-making and capitalize on market opportunities.
However, like any trading technique, divergence is not foolproof. Practice spotting divergences on a demo account, refine your approach, and always use sound risk management. With consistent effort, divergence can become a key component of your forex trading strategy, helping you navigate the markets with greater confidence and precision.