

The Moving Average Convergence Divergence (MACD) indicator is a powerful tool used by forex traders to identify momentum, trend direction, and potential reversal points. As a versatile and widely used technical analysis tool, the MACD provides insights into market behavior, helping traders make informed decisions.
This blog explores the components of the MACD, how it works, and practical strategies for using it to identify momentum in forex trading.
What is the MACD Indicator?
The MACD is a trend-following momentum indicator that measures the relationship between two moving averages of a currency pair’s price. It is composed of three main components:
1. MACD Line
- The difference between the 12-period exponential moving average (EMA) and the 26-period EMA.
- This line indicates the strength and direction of momentum.
2. Signal Line
- A 9-period EMA of the MACD line.
- It acts as a trigger for buy or sell signals.
3. Histogram
- The graphical representation of the difference between the MACD line and the signal line.
- Positive histogram bars indicate bullish momentum, while negative bars indicate bearish momentum.
How Does the MACD Work?
The MACD works by identifying shifts in momentum and trend direction based on the convergence and divergence of the MACD line and the signal line.
Key Concepts:
- Convergence:
- When the MACD line and the signal line move closer together, indicating weakening momentum.
- Divergence:
- When the MACD line and the signal line move apart, signaling strengthening momentum.
- Zero Line Crossovers:
- When the MACD line crosses above the zero line, it suggests bullish momentum.
- When it crosses below the zero line, it indicates bearish momentum.
Using MACD to Identify Momentum
1. Identify Trend Strength
- Bullish Momentum:
- The MACD line is above the signal line, and both are above the zero line.
- Positive histogram bars increase in size.
- Bearish Momentum:
- The MACD line is below the signal line, and both are below the zero line.
- Negative histogram bars increase in size.
2. Detect Trend Reversals
- Bullish Reversal:
- The MACD line crosses above the signal line from below.
- This crossover often occurs after a prolonged downtrend.
- Bearish Reversal:
- The MACD line crosses below the signal line from above.
- This crossover often occurs after a prolonged uptrend.
3. Analyze Divergence
- Bullish Divergence:
- Price makes lower lows while the MACD forms higher lows.
- Indicates weakening bearish momentum and a potential reversal upward.
- Bearish Divergence:
- Price makes higher highs while the MACD forms lower highs.
- Suggests weakening bullish momentum and a potential reversal downward.
Strategies for Using MACD in Forex Trading
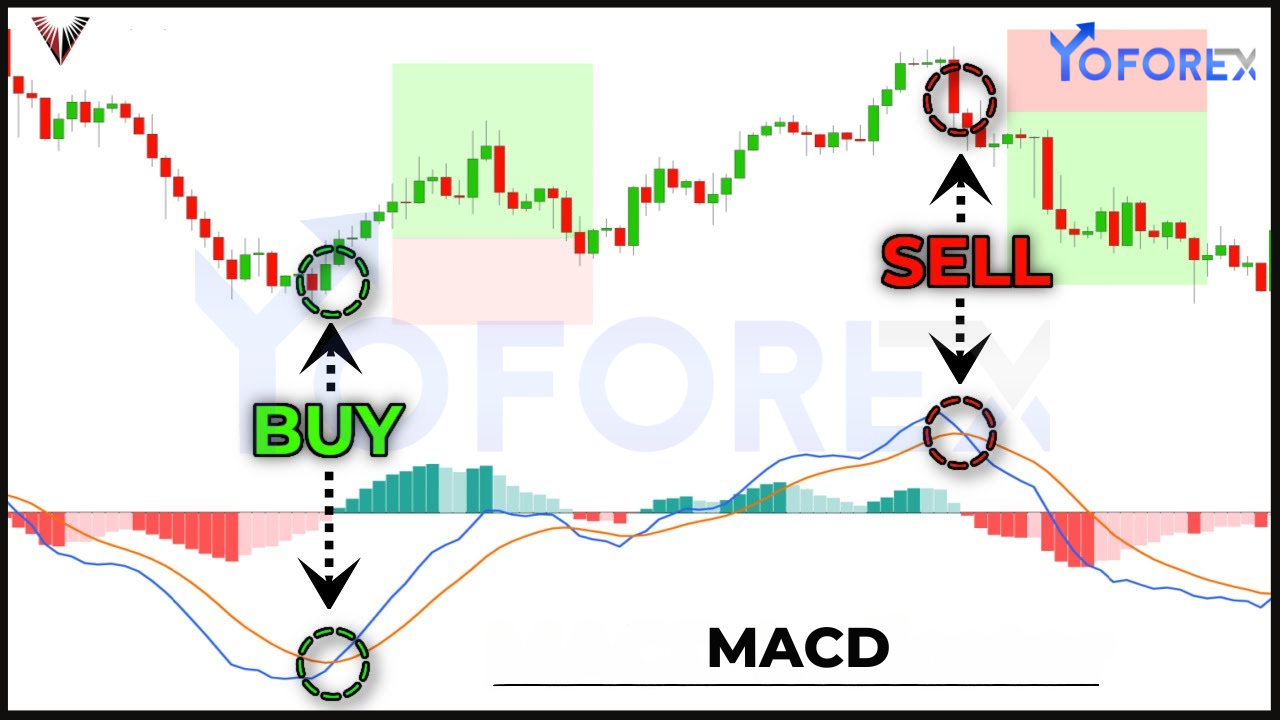
1. Crossover Strategy
The crossover strategy is one of the most popular ways to use the MACD.
- Buy Signal:
- When the MACD line crosses above the signal line.
- Sell Signal:
- When the MACD line crosses below the signal line.
- Tip:
- Use additional indicators or price action analysis to confirm the signals.
2. Zero Line Crossovers
- Buy Signal:
- When the MACD line crosses above the zero line, indicating bullish momentum.
- Sell Signal:
- When the MACD line crosses below the zero line, indicating bearish momentum.
- Application:
- Combine this strategy with support and resistance levels for better accuracy.
3. Histogram Analysis
- Trend Strength:
- An expanding histogram indicates strengthening momentum.
- A contracting histogram signals weakening momentum.
- Divergence Signals:
- Look for divergences between the histogram and price action to identify potential reversals.
4. Combine MACD with Other Indicators
Enhance the reliability of MACD signals by combining it with other technical indicators:
- RSI:
- Use the Relative Strength Index to confirm overbought or oversold conditions.
- Moving Averages:
- Use longer-term moving averages to identify the overall trend direction.
- Fibonacci Retracement:
- Combine MACD signals with Fibonacci levels to identify potential entry and exit points.
Risk Management When Using MACD
Trading with the MACD involves risks, especially during choppy or sideways markets. Effective risk management is essential to protect your capital:
1. Set Stop-Loss Orders
- Place stop-loss orders below recent swing lows for long trades or above recent swing highs for short trades.
2. Position Sizing
- Limit your risk to 1-2% of your account balance per trade.
3. Avoid Overtrading
- Stick to your trading plan and avoid entering trades based solely on MACD signals without confirmation.
Common Mistakes to Avoid
1. Ignoring Market Conditions
- The MACD performs best in trending markets and may give false signals in range-bound conditions.
2. Over-Reliance on MACD
- Use the MACD as part of a broader trading strategy rather than relying on it exclusively.
3. Neglecting Higher Timeframes
- Analyze multiple timeframes to avoid acting on short-term signals that contradict the overall trend.
4. Late Entries
- Entering trades too late after a crossover can reduce potential profits and increase risk.
Practical Example: Using MACD on EUR/USD
Scenario:
- Currency Pair: EUR/USD
- Timeframe: 4-hour chart
- Observation:
- The MACD line crosses above the signal line, and the histogram turns positive.
- The zero-line crossover confirms bullish momentum.
- Action:
- Enter a long position with a stop-loss below the recent swing low.
- Exit Strategy:
- Monitor the histogram and close the trade if the MACD line crosses below the signal line.
Conclusion
The MACD is a versatile and effective tool for identifying momentum, trend direction, and potential reversals in forex trading. By understanding its components and applying disciplined trading strategies, traders can gain a significant edge in the market. However, as with any indicator, the MACD should be used in conjunction with other tools and risk management practices to maximize its effectiveness.